
Here are the predicted ranges in major markets for next week by Trevor Smith.
Bulls may invalidate October’s bearish reputation, starting next week. That said, the Japanese yen and S&P 500 are likely to experience a short-term pullback that should provide bulls a long entry opportunity. The timeline for these trades uses monthly options because the candlestick buy signals are on three-day and weekly charts (see below). October/November calendar spreads give trades extra time for upcoming rallies to roll.
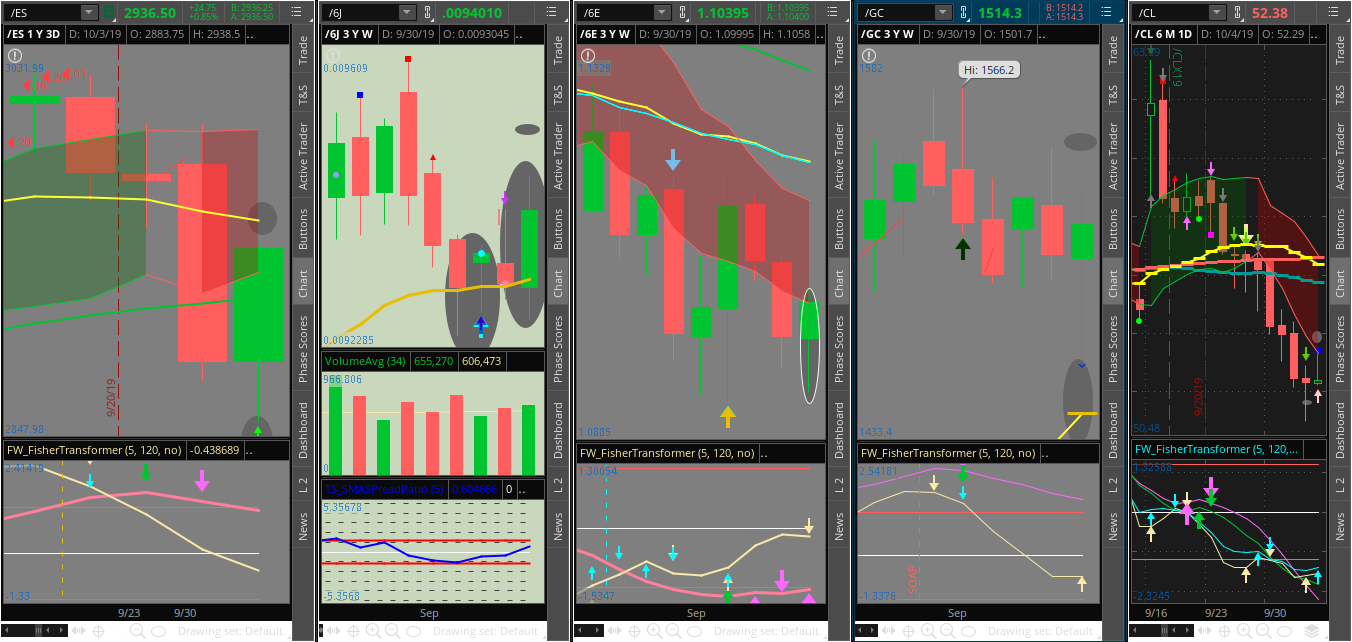
Above Charts: (from left to right) ES three-day chart extreme valuation bull candle; Japanese yen weekly bull candle on support; euro futures weekly hammer candle lows; gold weekly hammer high on 20-week moving average support w/ target above but under bear candles; Crude Oil Daily chart early low reversal setting up under Bollinger Bands/fair valuation. Charts: Courtesy of ThinkorSwim.
Last week, the “outlier” low-price event of 2870 in the S&P 500 occurred and was exceeded further after a pause. Current bullishness is so strong that I can’t rule out the other extreme outlier event of 2955.
Eight of our 10 projected ranges were hit/exceeded.
Next Week’s Predicted Ranges
E-mini S&P 500
High Range 3015-2978; Low Range 2895-2875 (outlier event= 3055 Sept. Monthly Camarilla resistance)
Buy weekly and monthly call spreads 2945/2950 strikes; Rationale: bull candlestick signals multiple time frames, range midpoint is 2945 fair value, unfulfilled 3012 retest overhead.
Japanese Yen
High Range 9468-9420; Low Range 9351-9330
Sell 9375/9400 call spread, then buy 9350/9375 call spread if price is under 9350 and reversal rally signals present. Rationale; daily chart inverted hammer sell for the week at next week’s midrange, bullish Oct. candles.
Euro FX
High Range 1.110-1.106; Low Range 1.099-1.096
Buy 1.1/1.1105 call spreads weekly, monthly on pullbacks. Rationale: Bullish weekly, three-day candlesticks; weekly range midpoint 1.103 and already holding above it.
Gold
High Range $1539-$1529; Low Range $1494-$1484
Buy $1505/1510 weekly/monthly call spreads on pullbacks. Rationale: Bullish weekly chart candle, slightly overbought, daily chart consistent with prior weekly sell bars may throwback down the tail of weekly hammer.
Crude Oil
High Range $5491-$5398; Low Range $5175-$5075
Sell $5250/52 weekly put spread on down move into next week’s lows. Rationale: Price is out of Bollinger Band value, sideways pivots mean narrow range, moving average supports, volatility rank
Last Week’s Projected Ranges Versus Actuals as of noon Oct.4
E-mini S&P 500
High Range 3018-3001; Low Range 2955-2940 (outlier events=2870. 3055 Monthly Camarilla resistance)
Actual: 2994-2955
Bearish technicals after 3001 tested above
Japanese Yen
High Range 9399-9373; Low Range 9311-9294
Actual: 9446-9264
Bull, then bearish; Euro may lead it up
Euro FX
High Range 1.105-1.102; Low Range 1.097-1.094
Actual: 1105-1093
Consider bull-skew strikes Iron Condor, or simple short put spread near low of next week near here on Fri
Gold
High Range $1533-$1524; Low Range $1501-$1489
Actual: $1525-$1465
Bearish weekly chart inverted hammer, bull Daily chart toward highs
Crude Oil
High Range $6300-$6000; Low Range $5700-$5500
Actual: $5667-$5099
See More analysis from Trevor here
Note: Nothing herein shall be construed to be specific financial advice. While reflecting my best good-faith efforts to forecast markets, no guarantees of accuracy are made from my range statistics, aggregate statistics, frequentist interpretations, and pivot math from hand calculations. I am a registered newsletter CTA, and all required disclaimers apply. Trade at your own risk with money you could discard/not miss.


