
Divergence in the relative strength of a Stock & Bond proxy ratio indicates trouble could be ahead for stocks, reports Joon Choi.
Last September, the Fed expected to initiate another rate hike in 2018, which they did in December, and three more times in 2019. However, the Fed was forced to pause future rate hikes earlier this year after the S&P 500 Index (SPX) recorded its worst fourth quarter performance (-14%) since 2008. Furthermore, economic weakness brought on by the trade war with China—any arguably extreme pressure from the Trump Administration— resulted in the Fed cutting rates twice (25-basis points each) in 2019 with expectations, based on Fed Fund futures, of two more 25-basis point cuts, probably after their October and December meetings.
Most asset classes were beneficiaries of falling interest rates through September. SPX rose 18.7%, its largest gain since 1997 (27.9%), and investment-grade bonds rose 8.6%, their largest gain since 1995 (13.2%). So, who is right? Are the bond investors right in preparing for a recession or are equity investors right in calling for further price gains? I want to shed some light on which class of investor may be on the right side.
The Study
I am utilizing weekly SPDR S&P 500 ETF Trust (SPY) data as a proxy for the S&P 500 Index and the iShares Core U.S. Aggregate Bond ETF (AGG) as a proxy for investment-grade bonds. Next, I divided SPY by AGG to create a SPY/AGG relative strength ratio; when this number increases it suggests SPY is stronger than AGG and vice versa. Since SPY has had higher historical returns than AGG, relative strength tends to be upsloping, except of course, when equities experience weakness. Although the relative strength of the two has been volatile for the past 21 months (since January 2018), the ratio is the same; meaning that SPY and AGG have had the same return during this period (see chart below).
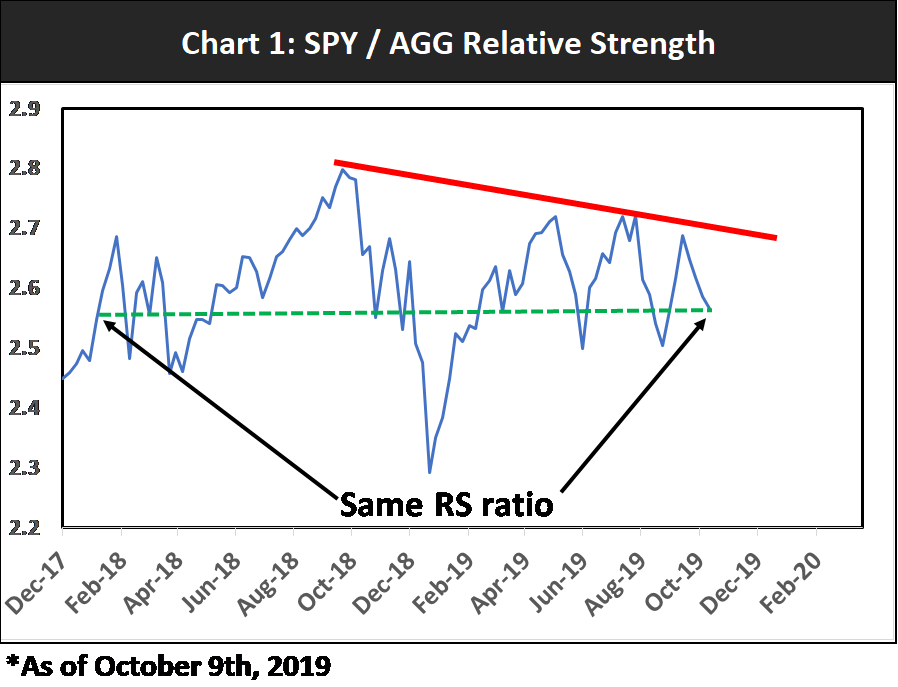
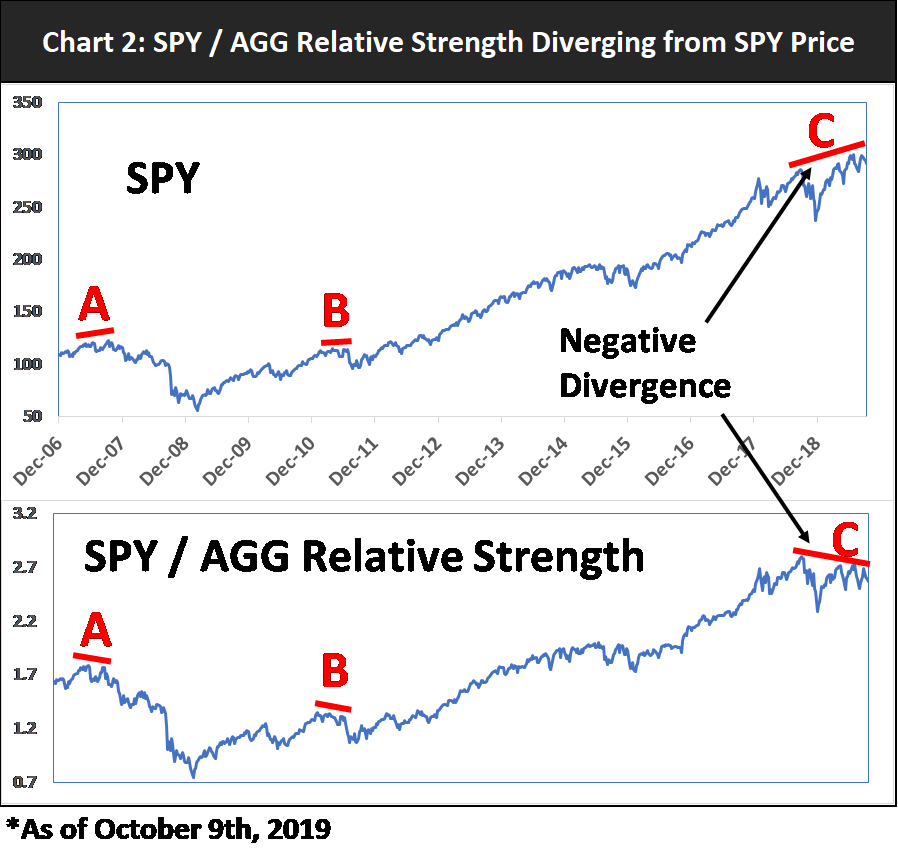
As an equity investor, I would like to see the relative strength ratio take out the downtrend line (red line) before I am convinced that equities are a better investment choice over investment-grade bonds. Moreover, relative strength peaks are trending lower since it reached its all-time peak last September. This occurrence is not reassuring because SPY has been rising during the same period which means the relative strength is diverging from SPY (point C in Chart 2, below).
This may be a bad omen if history serves as a guide. Observing chart 2 I noticed two other instances when the relative strength diverged from SPY. It happened in 2007 prior to the financial crisis and its 55% drawdown (Point A). Its most recent occurrence was in 2011 prior to a 19% drawdown in the summer (Point B).
Conclusion
As both equity and bond markets are near their highs, it is inconceivable to expect both asset classes to march much higher. The SPY/AGG relative strength ratio seems to indicate that equity weakness may be around the corner. However, if relative strength penetrates the downtrend line for two consecutive weeks, then I will be further convinced that equity investors were correct in anticipating further price advances, and I will adjust my stock exposure accordingly. I will keep you updated on future developments.
Sign up here for a free three-month subscription to Dr. Marvin Appel’s Systems and Forecasts newsletter, published every other week with hotline access to the most current commentary. No further obligation.


