
Regional banks as represented by the SPDR Regional Banking ETF (KRE) have underperformed, but have proven to be a good indicator for the broad stock market, reports, Bonnie Gortler.
Small-cap, mid-cap, transports, financials, and bank sectors have been weaker than the S&P 500 in 2019, implying caution by investors not willing to invest in riskier assets.
These sectors continue to lack leadership, not favored by investors and remain far from their all-time highs. The major averages, Dow Jones Index, S&P 500 and Nasdaq 100 are all less than 4% from their all-time highs. On Oct. 3 the averages had an upside reversal, rising by approximately 2%. However, the major averages stalled at resistance, raising concern the reversal was false. This is a common occurrence. It occurred on Oct. 8 and again on Oct. 9. All tests are not successful, as sometimes the lows get violated and a decline follows.
Time will tell if the trading range that the major averages are in will be violated to the downside, or if the last several months have been a base for a new leg to the upside. If the lagging sectors begin to show strength this would be a bullish sign that higher prices are ahead.
Keep an eye on Regional Banks
The top part of the chart below shows the SPDR Regional Banking ETF (KRE) price with a 50-week moving average (blue line) that traders watch and use to define trends. KRE tracks an equally weighted index of common stocks including leading regional banks or thrifts (savings and loan associations). KRE is a volatile ETF at times, even though it holds 125 stocks and its top 10 holdings are each less than 3%.
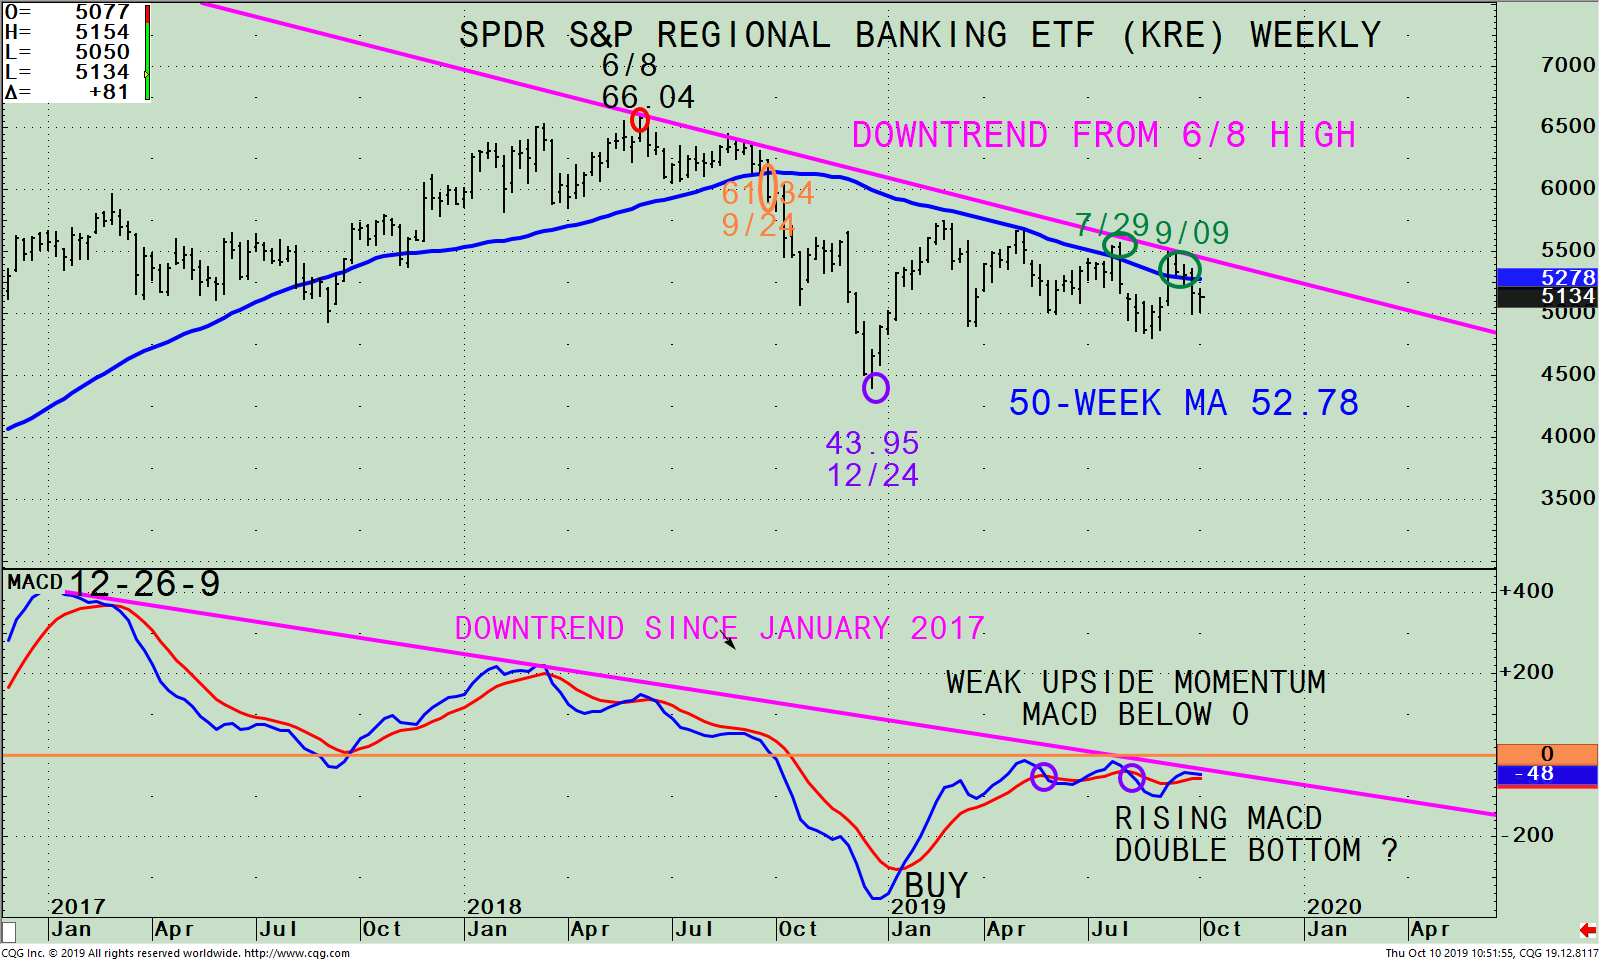
Figure: SPDR Regional Banking ETF (KRE) Weekly Price (Top), and MACD 12-26-9
I like to watch the KRE for clues of a potential trend change. When the KRE is strong, it tends to be a positive sign for the broad market. However, when KRE lags, it tends to be a warning sign that underlying weakness may persist.
KRE has been weaker in terms of relative strength compared to the S&P 500 and is approximately 22% below its all-time high made on June 8, 2018. KRE fell below the 50-week Moving Average on Sept. 24, 18 at 61.84 (orange circle), selling accelerated before finally making a low at 43.95 on Dec. 24, 2018. KRE reversed sharply along with the major averages to the upside in January but stalled at its 50-week moving average which acted as resistance.
KRE then declined, testing the December lows. Another rally followed which again stopped at the 50-week moving average. This pattern continued until KRE was finally able to penetrate the 50-week in July 2019 (green circle). However, notice how KRE didn’t have enough strength to break its weekly downtrend (pink line) and fell.
KRE at the time of this writing is at 51.35. For the broad market to sustain a meaningful advance, the KRE and the sectors that have been lagging, need to begin showing signs of strength. It would be bullish if KRE can first close above the weekly 50-week moving average at 52.78 (2.75% above) and then gain enough strength to break the weekly downtrend, approximately at 55.00. Support is at 47.98, the Aug. 26 low. A close below 47.98 would negate my positive outlook and imply a move lower to potentially test the Dec. 24, 2018 low at 43.95.
The lower portion of the chart is MACD (12, 26, 9 week), a technical indicator that measures momentum. MACD indicated a buy in January but has shown weak momentum (orange horizontal line) where it’s been unable to get above 0 on each rally this year. MACD since January had numerous crossings above and below its signal line (purple eclipses).
Near-term momentum is improving. A possible double bottom has formed. It would be bullish if MACD would continue to rise and break the downtrend (pink line) from January. This would imply more gains in the coming weeks. It’s also positive that MACD is oversold and has potential favorable patterns forming on the daily and monthly charts as well as weekly. When the trend shifts to favorable, this is when to buy. On the other hand, I would be very concerned if weekly MACD makes a lower low. This would give a warning sign of a potentially serious decline ahead.
In Sum
Watch the near-term movement of Regional Banks. If KRE closes above the weekly 50-week moving average at 52.78 this would be positive for the broad market. When KRE is a leading sector, it tends to be positive for the overall market. If KRE rises in the near term and starts to outperform the S&P 500 (SPY) this would be a bullish sign for more gains in the fourth quarter.
I would love to hear from you. E-mail at bgortler@signalert.com to share your thoughts or ask me any questions you might have. Sign up here for a free three-month subscription to Dr. Marvin Appel’s Systems and Forecasts newsletter, published every other week with hotline access to the most current commentary. No further obligation.


