
Several banking stocks are nearing key breakout/breakdown levels in a Rectangle Chart Pattern, writes Suri Duddella.
Rectangle Channel patterns are formed by price action between two key trendlines bound by multiple equal (near) highs and lows. The duration of the pattern can be a few days to several months. Longer duration patterns are considered to be more reliable. The pattern must have at least two pivots (equal highs or equal lows) on each of the trendlines. The price breakout can occur in any direction from the pattern, but the general belief is price typically breaks out in the same direction as prior trend before the pattern formation. The volume inside the pattern is non-decisive, but volume tends to increase during the breakouts.
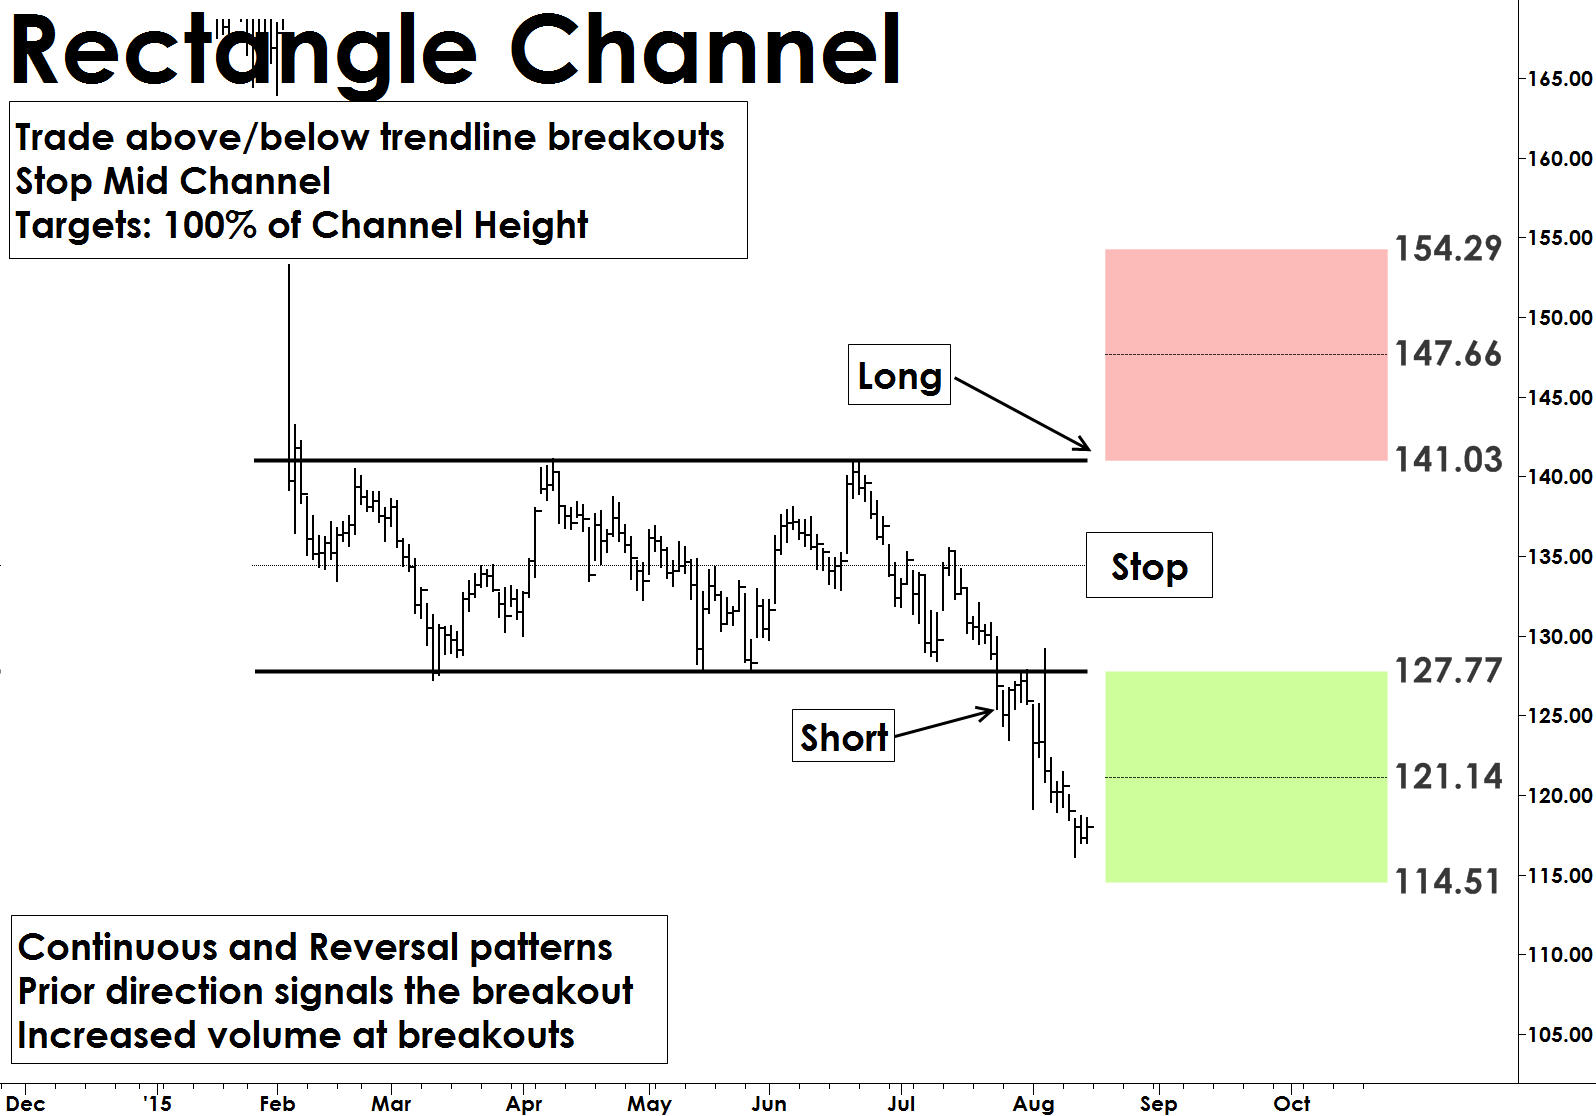
Trade: A trade setup occurs when price closes outside the trend line (upper or lower) at least two bars signaling a breakout. Trades are entered on a follow-up bar at high above the breakout bar or low below the breakdown bar (see graphics below).
Target: Targets in Rectangle Channel formations are based on the depth of the rectangle pattern. Targets are usually set at 70 to 100% of the depth of rectangle from the trade entry.
Stop: Rectangle patterns fail when prices retrace into the middle of the rectangle channel. Place a stop order just below the middle of the channel.
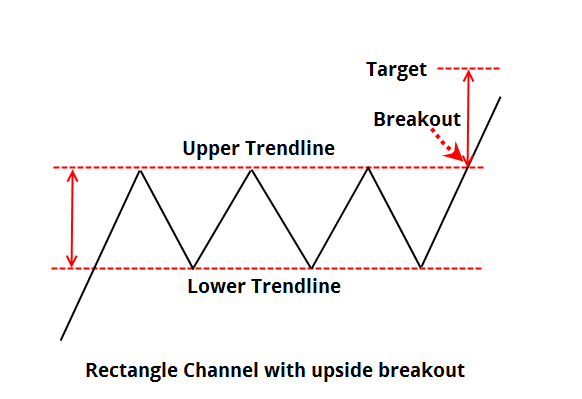
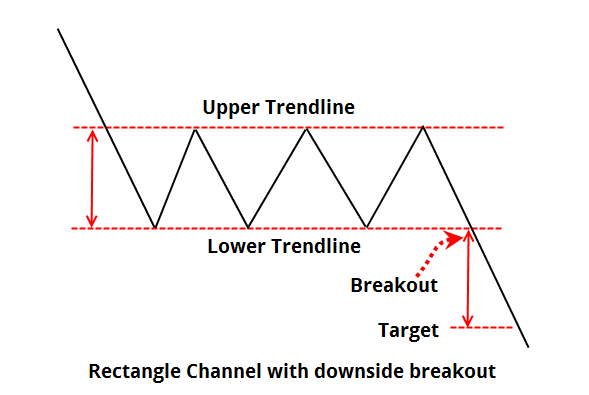
This chart shows that the signal could come in either direction, but generally moves in the direction of the trend prior to the range consolidation.
Banking on Breakouts/Breakdowns
The Banking and Financial sectors are the barometer of any country's economy. These sectors comprise companies that provide consumers with financial services. Investors closely watch these sectors along with other key sectors like Transportation, Industries and Utilities. Investors look for a strong financial and banking sector for a stable and healthy economy.
Low interbank lending rates and a growing economy have helped the banking sector in the last few years.
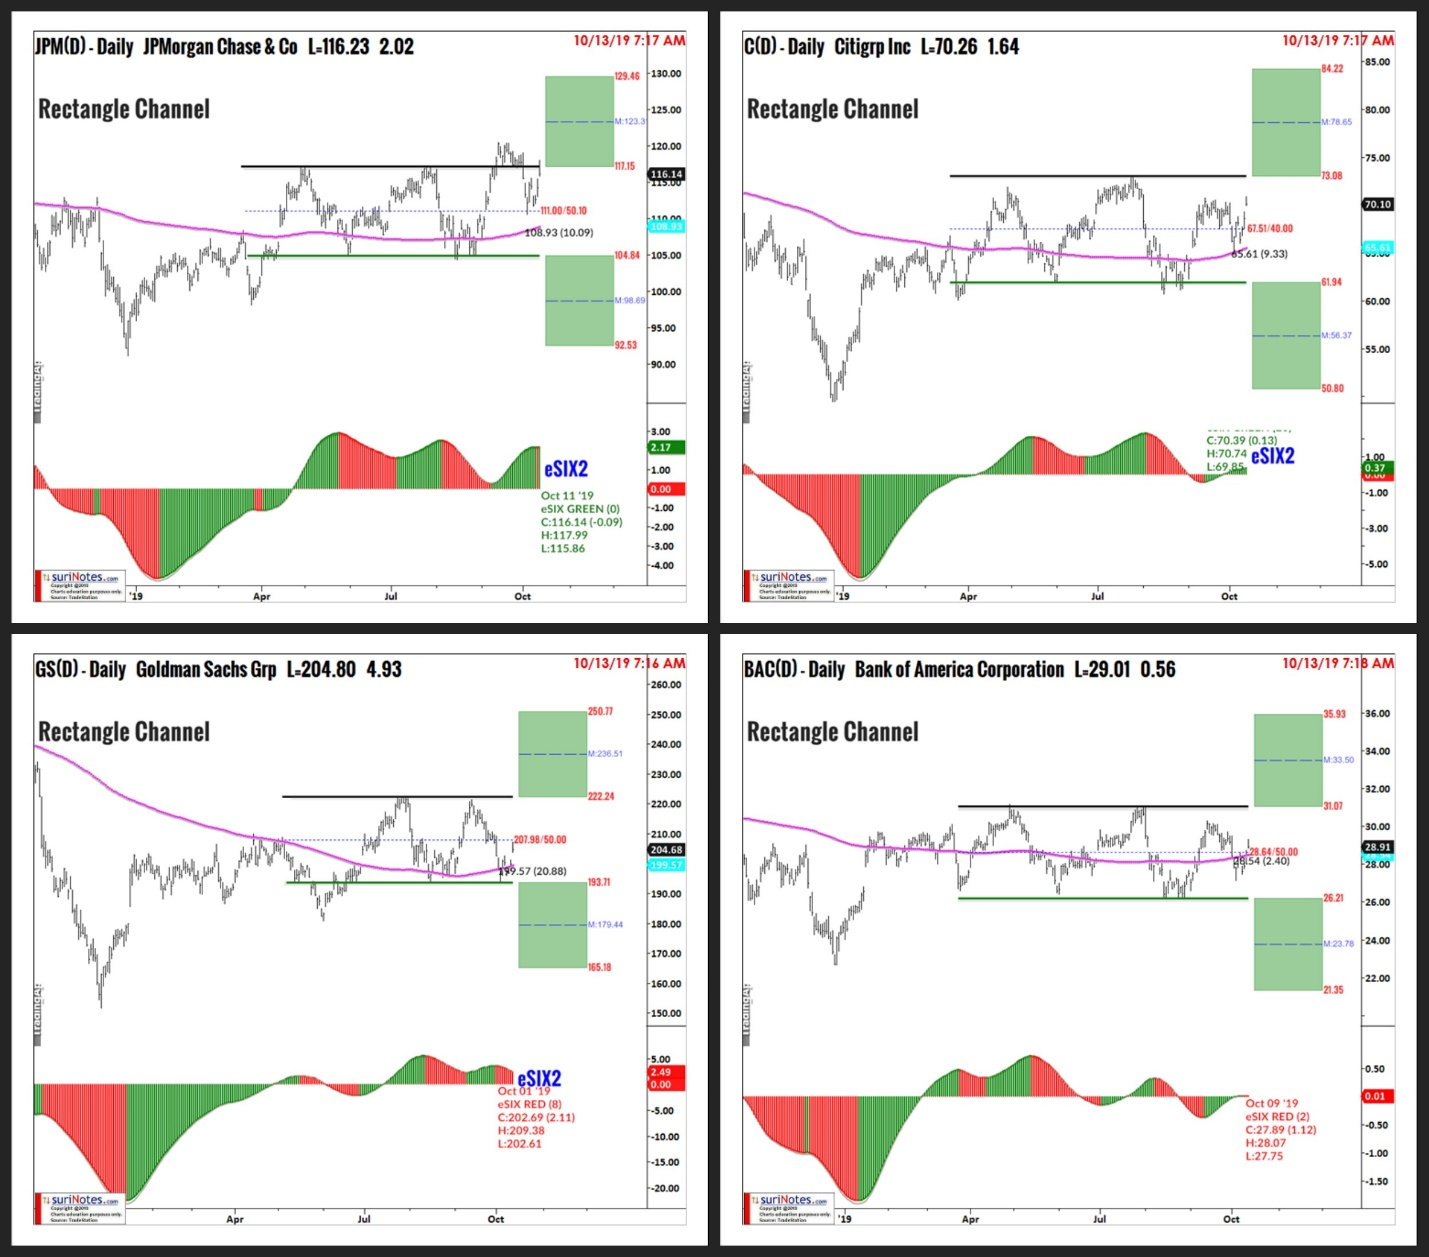
Several banking sector stocks are currently trading in Rectangle Channel Patterns and nearing breakout/breakdown levels. JPMorgan (JPM), Citigroup (C), Goldman Sachs (GS) and Bank of America (BAC) are relatively correlated so they all are exhibiting a similar pattern, however, JPM looks near a breakout where the others are closer to the middle of the pattern and could go either way. All four were rallying off of the Q4 2018 sell-off so the strongest signal would be an upside breakout.
Trading Bank Stocks Rectangle Channel Patterns
- JPMorgan is trading in a Rectangle Channel pattern from April 2019 to October 2019. The breakout level is $117.15. Targets: $123-$129, Stop: $111 (see chart below).
- Citigroup is trading in Rectangle Channel pattern from April 2019 to October 2019. The breakout level is $73.08. Targets: $78-84. Breakdown level: $61.94. Downside targets: $50-56.
- Goldman Sachs is trading in a Rectangle Channel pattern from July 2019 to October 2019. Breakout level: $222.25, Targets: $236-250. Breakdown level: $193.71. Downside targets: $165-$179.
- Bank of America is trading in a Rectangle Channel pattern from April 2019 to October 2019. Breakout level: $31.07, Targets: $33.5 to $35.93.
Find more of Suri’s work at surinotes.com.


