
It’s time to reallocate some of your high yield bond exposure from long-term to shorter-term, writes Joon Choi.
As the Federal Reserve reversed its stance from raising to neutral to cutting rates, all asset classes are faring well this year. Within the fixed income class, the high yield bond sector is performing the best. The SPDR Barclay High Yield Bond ETF (JNK) is up 13.4% year-to-date. As investors continue to chase higher income and drive down yields, should we be worried? The high yield sector may be overbought, and shorter-term high yield bonds may be a better alternative.
Overview of JNK and SJNK
JNK is a high yield bond ETF that was created in December 2007 after the stock market peaked a few months before. It’s the second most liquid EFT in the high yield space; the iShares iBoxx $ High Yield Corporate Bond ETF (HYG) has twice the assets but they have performed the same since 2008. The SPDR Bloomberg Barclays Short Term High Yield Bond ETF (SJNK) is a shorter-term high yield bond ETF that was launched in March 2012. This ETF’s benefit is that it has lower interest rate risk, as the average maturity of bonds in the portfolio is only about half of JNK’s: 3.2 vs. 6 years respectively. Similarly, its duration (a measure of interest rate sensitivity) is 1.6 years compared to 3.1 years for JNK.
Since SJNK’s inception, it has trailed JNK’s return by 0.9% per year (4.1% vs. 5%) but with one third less volatility measured by standard deviation. In short, investors are willing to trade off some return for lower volatility when they invest in SJNK over JNK.
JNK overbought vs. SJNK?
Even though JNK has performed well this year, it’s currently stuck at the same level for the last six weeks. It appears that investors are waiting for more clarity on the Fed’s decision later this month and an update on the trade dispute with China. In order to analyze the relative valuations between JNK and SJNK, I divided the former by the later to create a relative strength indicator. As you can see on the bottom half of Chart 1, the relative strength has increased sharply since the stock market lows in late December. In fact, JNK has outperformed SJNK by 6.3% during this period (Point B) which led to a large separation between the two equity curves (top section of Chart 1 below).
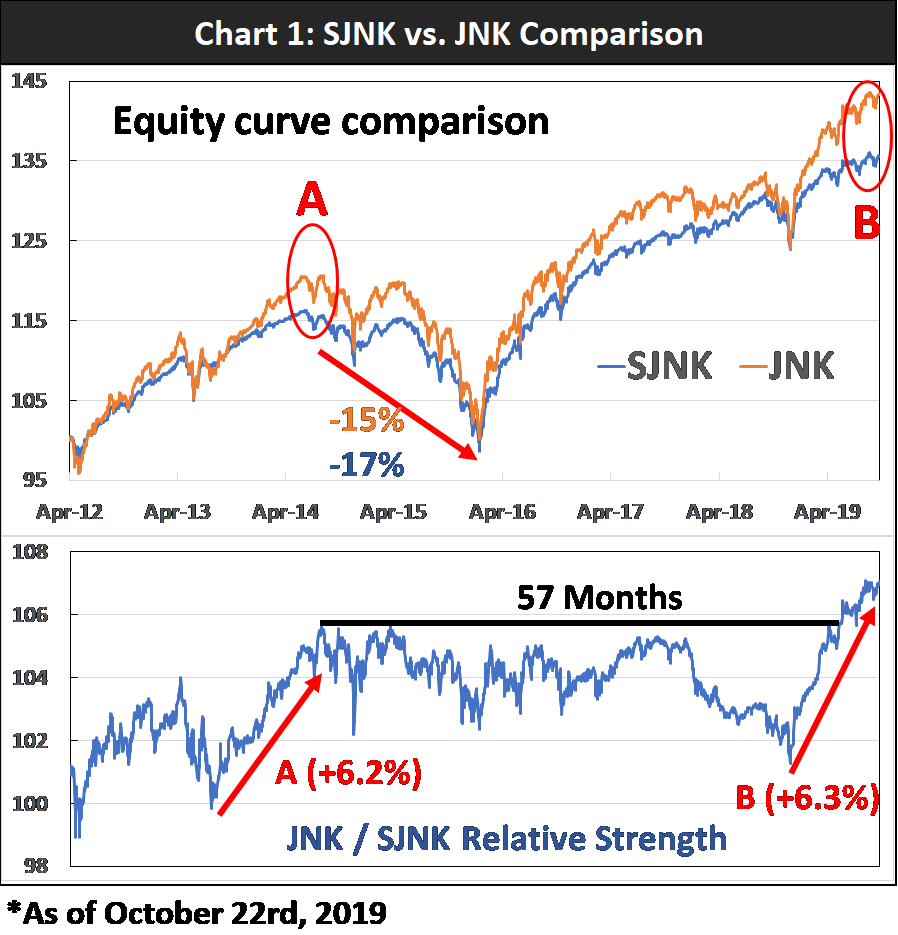
The last time JNK sharply outperformed SJNK was in 2013-14 when it gained 6.2% more than SJNK; albeit it took few months longer. JNK’s equity curve was stretched above SJNK’s (Point A), similar to the current situation. This outperformance was followed by a 15 and 17% correction in the ETFs respectively. It took 57 months for JNK/SJNK relative strength to make new highs. This suggests that SJNK would have been a better investment choice over JNK during the period since it had same returns but with much less volatility. If history serves as a guide, we may experience a similar path between the two ETFs. My analysis suggests that shorter-dated high yield bonds may offer better value than longer ones.
Digging Deeper
To my surprise, the 30-day SEC yields are similar for JNK and SJNK: 5.26% vs. 5.13% respectively. This means that investors are barely being compensated for holding longer-dated bonds. This phenomenon intrigued me, so I compared the historical yields of these two ETFs. Unfortunately, I could not obtain prior SEC yields; thus, I calculated the 12-month dividend distribution yield by adding the trailing 12-month dividends and then divided the total by the average price during the time span.
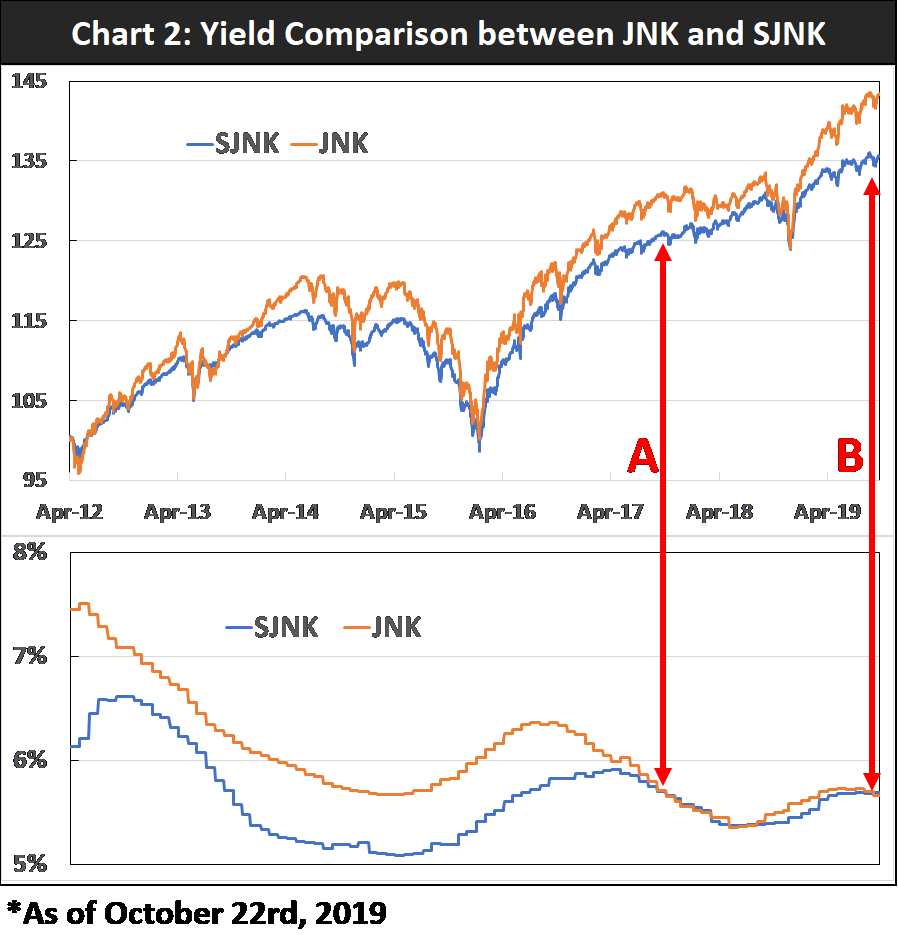
When I charted the past dividend distribution yield, I noticed that JNK’s 12-month dividend distribution yield was actually lower than SJNK’s; 5.67% vs. 5.69% respectively (see chart 2 below). The only other occasion when JNK distributed less (in %) than SJNK was in 2017 (point A on chart). JNK was flat in the ensuing 14 months whereas, SJNK gained 2%; not much but still better than JNK.
Conclusion
Low yields around the world are forcing investors to pile into the U.S. high yield bonds resulting in lower yields. Longer-dated high yield bonds like JNK, seem to be overcrowded as their average dividend distribution yield is lower than that of shorter-dated ones like SJNK.
In addition, JNK/SJNK relative strength indicates that JNK may have rallied too much versus SJNK and as a result may underperform SJNK for the foreseeable future. I recommend replacing some of your high yield bond exposure with shorter-term investments such as SJNK. Although this sector seems overbought, high yield bonds are too valuable for an allocation reduction. That’s why it is so important to utilize an effective high yield model to improve returns while containing the risk. I have uncovered a few short-duration high yield bond funds that perform better than SJNK on our high yield model and we have begun using these for clients.
Sign up here for a free three-month subscription to Dr. Marvin Appel’s Systems and Forecasts newsletter, published every other week with hotline access to the most current commentary. No further obligation.


