
Expect a new all-time high in the E-mini S&P within the next few weeks or sooner, writes Al Brooks.
The E-mini S&P 500 formed an outside up in October on the monthly chart. Traders should expect a new all-time high within a few weeks and possibly this week.
The monthly E-mini S&P500 futures triggered an outside-outside (OO) buy signal when July went above the June high. June and May were consecutive outside bars, which is an “OO” bull flag (see chart below). Rather than rallying, the E-mini has stalled. It has been sideways in a tight trading range for four months and within a slightly bigger trading range for seven months. However, it is still in a bull trend, and therefore traders expect higher prices.
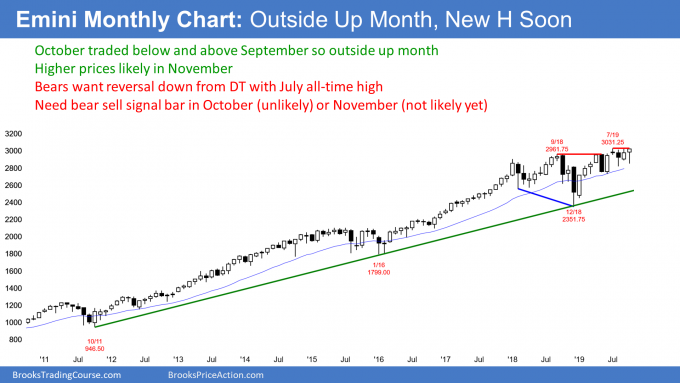
October traded below the September low. On Friday, it traded above the September high, which is slightly below the July all-time high. October is now an outside up bar. That increases the chance of higher prices in November. The probability will increase if October closes above the September high and the all-time high. It would increase further if it closes on the high of the month and far above that resistance.
With the E-mini within about 1% of the all-time high, it could easily get there this week. If it closes at a new all-time high, that would be an additional sign of strength and further increase the chance of higher prices in November.
There is always a bear case. The bears have a 40% chance of big bear bar in in November. If they get it, November would be a sell signal bar for December.
But it would also be the fifth bar in a tight trading range in a strong bull trend. That would make it a weak sell setup. The best the bears can probably achieve in November is another sideways month in the five-month trading range.
Weekly breakout above small bull flag
The E-mini S&P 500 futures triggered a High 1 bull flag buy signal two weeks ago on its weekly chart when that weekly bar moved above the high of the week before. Because the past six weeks have had prominent tails and had been sideways, traders are selling rallies and buying selloffs. Therefore, the buy signal was weak (see chart).
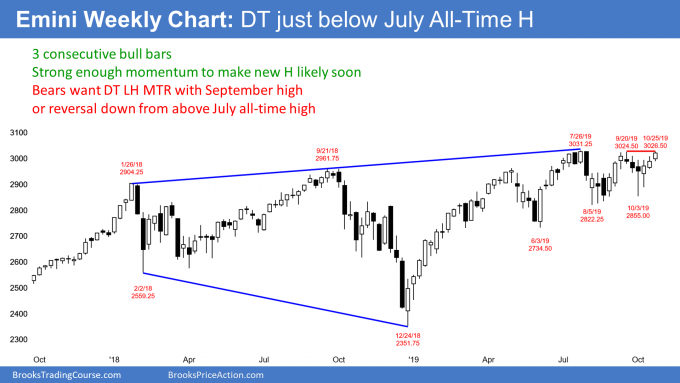
The entry bar two weeks ago was small and therefore not strong. This week was the follow-through bar. It closed on its high, which is more bullish, but its range was small.
Nevertheless, the chart is forming higher lows and it is still in a bull trend. Traders believe that the E-mini will make a new high within the next few weeks, and possibly this week.
The bears have a 30% chance of a strong reversal down this week. If they succeed, there would then be a double top with the September high. But because of the higher lows and strong yearlong bull trend, the reversal down would likely be minor. That means that the bears might get a two- to three-week pullback to the October low, which is the neckline of the small double top.
It is unlikely that they will get a strong breakout below that neckline and then a measured move down. The selloff would probably just be a brief leg down in the four-month trading range.
Daily Chart has had many reversals
The S&P 500 E-mini futures has been in a weak bull channel for a couple of weeks on its daily chart (see below). It is essentially in a small, tight trading range that is tilted slightly up. There have reversals every couple of days. Even though it is channeling up, this is still a type of Breakout Mode pattern.
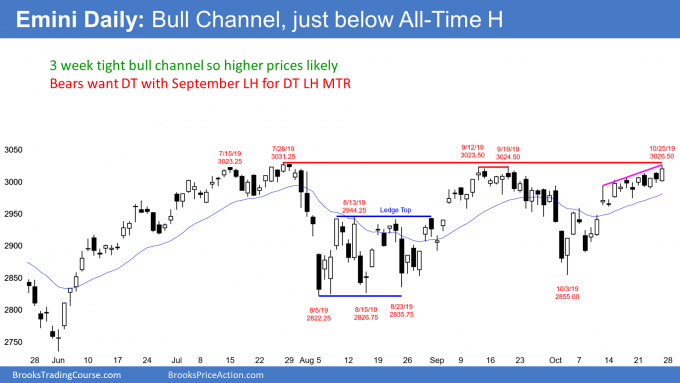
When there is a horizontal Breakout Mode pattern, there is about a 50% chance of a successful bull breakout and a 50% chance of a successful bear breakout. Furthermore, there is a 50% chance that the first breakout up or down will fail and reverse.
But this is different because the tight range is tilted up. In this case, the chance of a successful bull breakout is 60%. The E-mini might waiting for Wednesday’s 1 p.m. CDT Federal Reserve Open Markets Committee (FOMC) announcement before it breaks out up or down.
Trading Room
Traders can see the end of the day bar-by-bar price action report by signing up for free at BrooksPriceAction.com. I talk about the detailed E-mini price action real-time throughout the day in the BrooksPriceAction.com trading room. We offer a two-day free trial.


