
There are several technical patterns prepared to pop in the Biotech sector, according to Suri Duddella.
The year for the Biotech sector has been about two different halves. The SPDR S&P Biotech ETF (XBI) is up 14.59% year-to-date, but it declined more than 18% in the last six months as money continued to flow out of the sector after its hots start.
The bifurcated performance can also be seen in the individual stocks within the sector. Few stocks in the Biotech sector have performed as well as Celgene Corp. (CELG), up 65.86%, Incyte Corp. (INCY), up 31.07% or Abbott Labs (ABT), up 15.37% for the year. However, many other stocks like Biogen (BIIB), down 1.14%, Pfizer (PFE), down 12.46% and Eli Lilly (LLY), down 3.50% have underperformed both the market and the sector.
Below is a list of major Biotech stocks and their performances in 2018 and 2019.
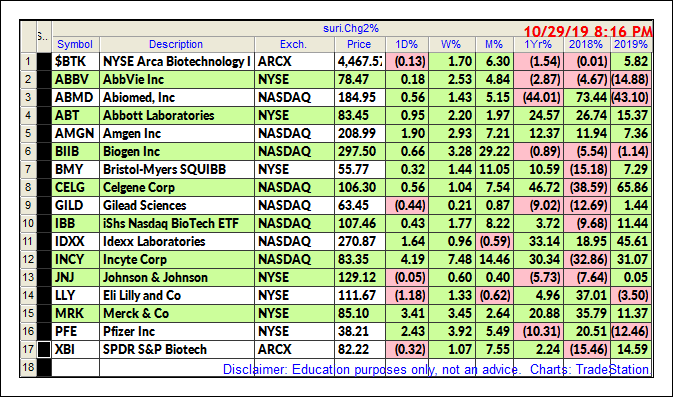
Biotech Stocks chart patterns
Several stocks in the biotech sector having interesting technical set-ups and could breakout in the final quarter of 2019. IBB
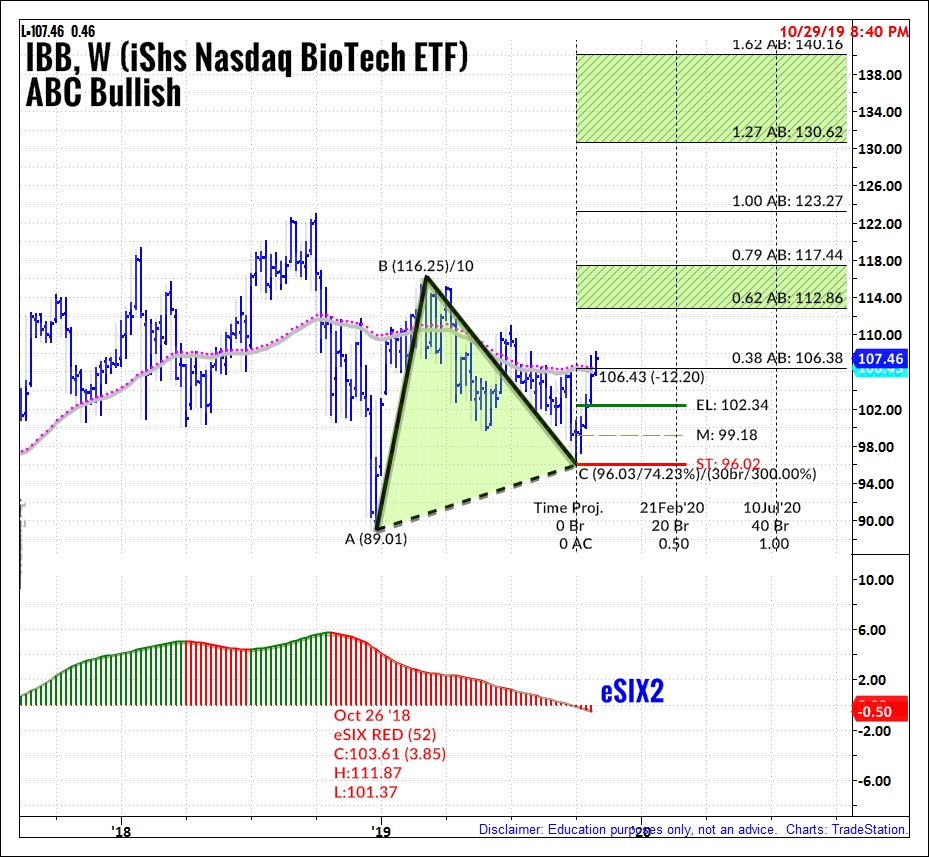
ABC Bullish Pattern
Nasdaq Biotechnology ETF (IBB) is currently trading in an ABC Bullish pattern on its weekly chart. Price in IBB is crossing above the 200-week moving average as it completes the C-wave of an ABC Bullish pattern (see chart below). The long entry is above $107.5 with targets $112-$117 and $123.
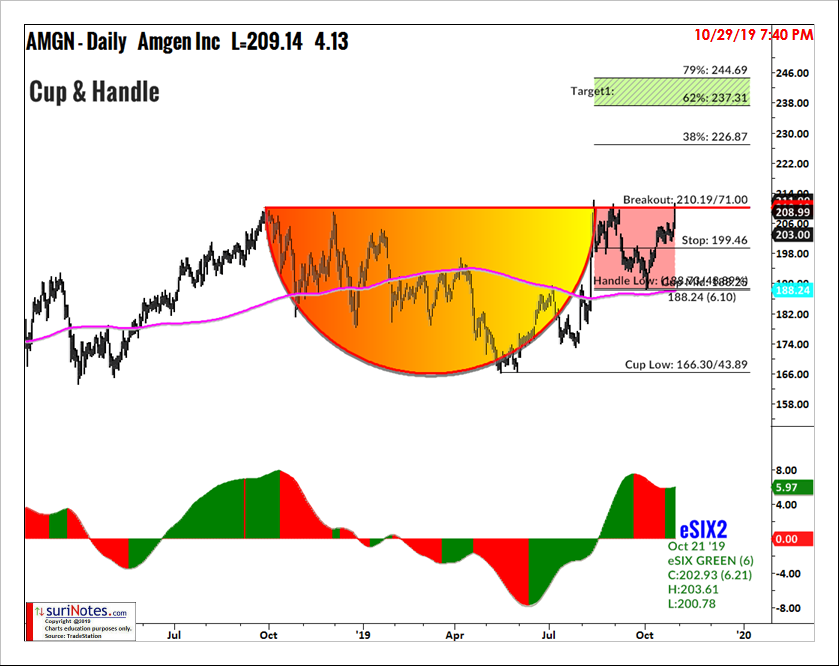
Cup & Handle
Amgen Inc. (AMGN) is trading in a Tuesday Oct. 29, it signaled an upside breakout (see chart below). Targets are: $226, $237 and $244.
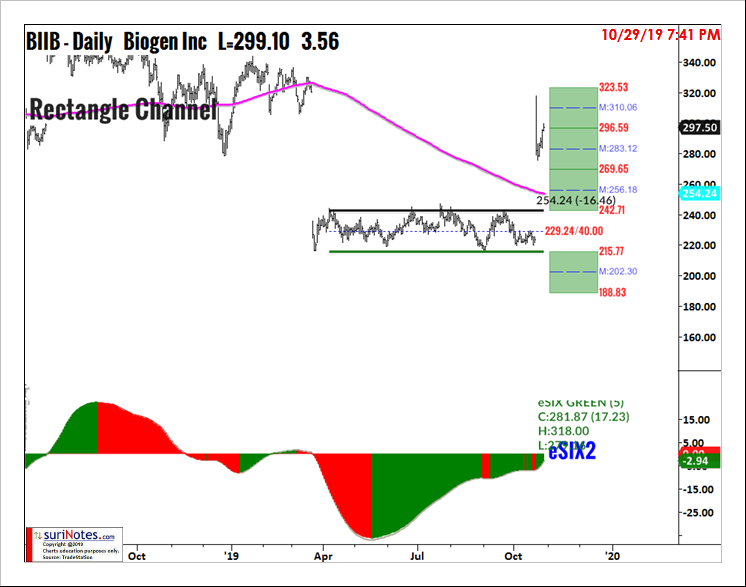
Rectangle Patterns
Biogen Inc. is trading in a Rectangle Channel pattern on its daily chart. The channel boundaries are $242.71 and $215.77. The mid-channel level is $229.24 and channel depth is: 26.9 (see chart). Price is trading above upper trendline and has already reached its first two breakout targets of $269.6 and $ 296.6. Its next target is $323.53.
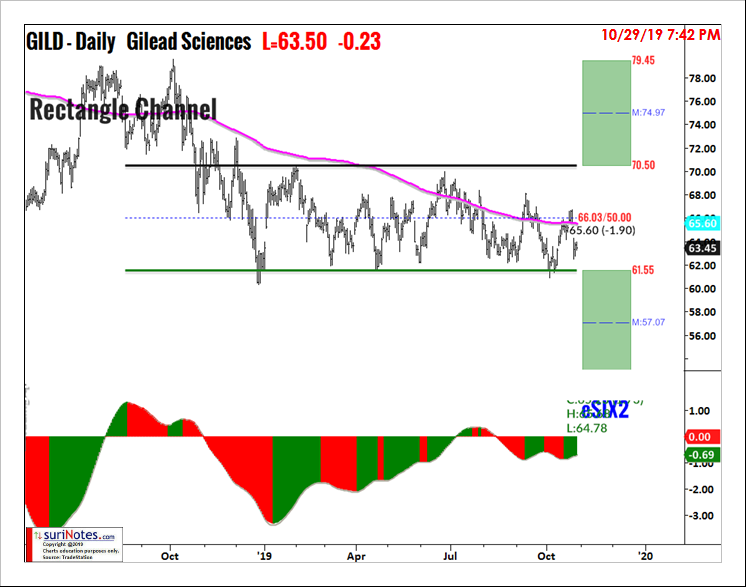
Gilead Sciences (GILD) is also trading in a Rectangle Channel pattern on its daily chart. The channel boundaries are $70.50 and $61.55. The mid-channel level is $66.03 and channel depth is: 9.0. Price is trading between upper and lower trendlines and has not committed to a breakout/breakdown direction as of yet (see chart). If GILD breaches $70.50 on the upside that would signal a breakout long signal with a profit targets of $75.0 to $79.50.
If GILD breaks below the downside boundary of $61.55 it would signal a short signal with breakdown targets of $57.10 to $52.60.
Find more of Suri’s work at surinotes.com.


