
The latest COT analysis is signaling reversals in cocoa and feeder cattle reports Andy Waldock.
The cocoa market has reached its highest point since May of last year. Correspondingly, this has attracted significant producer selling as they try to lock in future deliveries at currently traded prices. Remember, we read the Commodity Futures Trading Commission’s (CFTC) Commitments of Traders (COT) reports from a business plan modeling perspective. We follow the commercial trader category because they have their hands in the dirt. These are the producers and processors of the global commodity trade. We put their research to work for us by tracking their actions in the markets they trade.
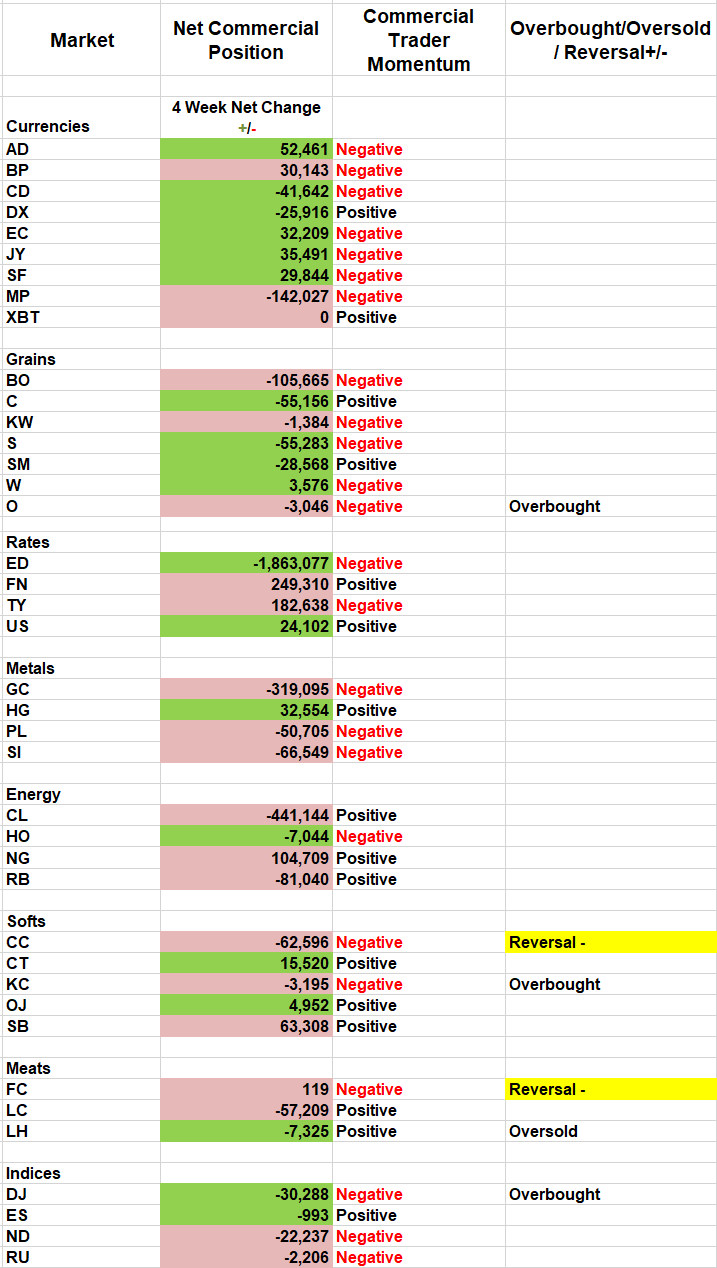
Right now, cocoa producers just set a new 52-week bearish mark for their net position (see COT Table below). Our one, two, three approach suggests that the commercial selling was mostly responsible for the cocoa market’s reversal, this week.
Our one, two, three methodology is based on mean reversion. All market runs come to an end. Whether the reversal is caused by running out of speculators or businesses applying pressure in the opposite direction as they lock in gains, we plan to catch the turn and ride it back to the market’s mean.
One, commercial traders’ momentum is becoming increasingly negative.
Two, March cocoa futures have stretched their speculative gains into overbought territory. The opposing indicators of negative commercial momentum and an overbought underlying market are the key to setting the trigger for the mean reversion trade.
Three, the market shows some signs of reversing. There’s an old saying, “Never catch a falling knife.” This adage applies to trading, as well. We don’t pick tops and bottoms to enter a market. We determine bias and wait for the market to tell us when it’s time for the reversal. Last week, cocoa’s weakness created the swing high, against which we’ll take a short position.
The last piece of the method is risk control. The reversal is pattern-based. Therefore, the protective stop should always be placed at the most recent swing high or low. Protection is why our worksheets for both the Daily and Weekly COT Signals contain an additional column with the protective stop prices issued for the trades.
Feeder Cattle
Moving to feeder cattle, we have a very similar setup to the bean oil trade from last week (see table above). The feeder cattle trade is also an excellent example of late-arriving speculators losing their cash again.
The net speculative position remained flat through the early stages of this fall rally. However, once prices crept above the May-August highs, speculative trend followers felt obligated to join the market’s bid. The large speculators added about 4,500 long positions over the last few weeks between $141 and $147. We closed the week at $139, putting all of these positions on the losing side.
Those speculators are beginning to take their losses, and this has triggered a short sale set up because of the conflict between the commercial traders’ negative momentum and the speculative buying pushing the market above our overbought threshold.
Furthermore, like the soybean oil trade, the feeder cattle peak and reversal has come just as we reached long-term overhead resistance between $146 and $149.
Following up on the bean oil trade, the protective buy stop can be lowered to $39.40.
Finally, those watching the crude oil market’s consolidation should keep an eye on the confluence of overhead resistance just above $60 per barrel while the upward weekly trend line supporting prices now comes around $52.25.
Register at WaldockTrading.com for access to back issues. Here is what Andy had to say about seasonality and the COT Report at the TradersEXPO New York. Visit Andy Waldock Trading to learn more. Register and see our daily and weekly signals archive for entries and stop loss levels sent to our subscribers.


