
Here is an interesting seasonal trade that that gets triggered on Black Friday, notes Andy Waldock.
The U.S. shopping season begins in earnest with “Black Friday.” Holiday sales ads have increasingly targeted electronics. Shopping patterns have grown into a measurable impact on the Japanese yen, lasting from approximately, Black Friday through Christmas.
The Japanese yen displays seasonal weakness between Black Friday and Christmas. I measure seasonality in many ways. Taking an average of the closing prices from the beginning and end of the period in question is one way to measure seasonality. Based on these averages, the yen has fallen between Black Friday and Christmas in 10 of the last 15 years, with an average decline of 2.6%. A 2.6% decline from the current area around .9200 is a fall of nearly 240 points or $3,000. Furthermore, a 240-point drop creates a violation of significant weekly support on the chart, below.
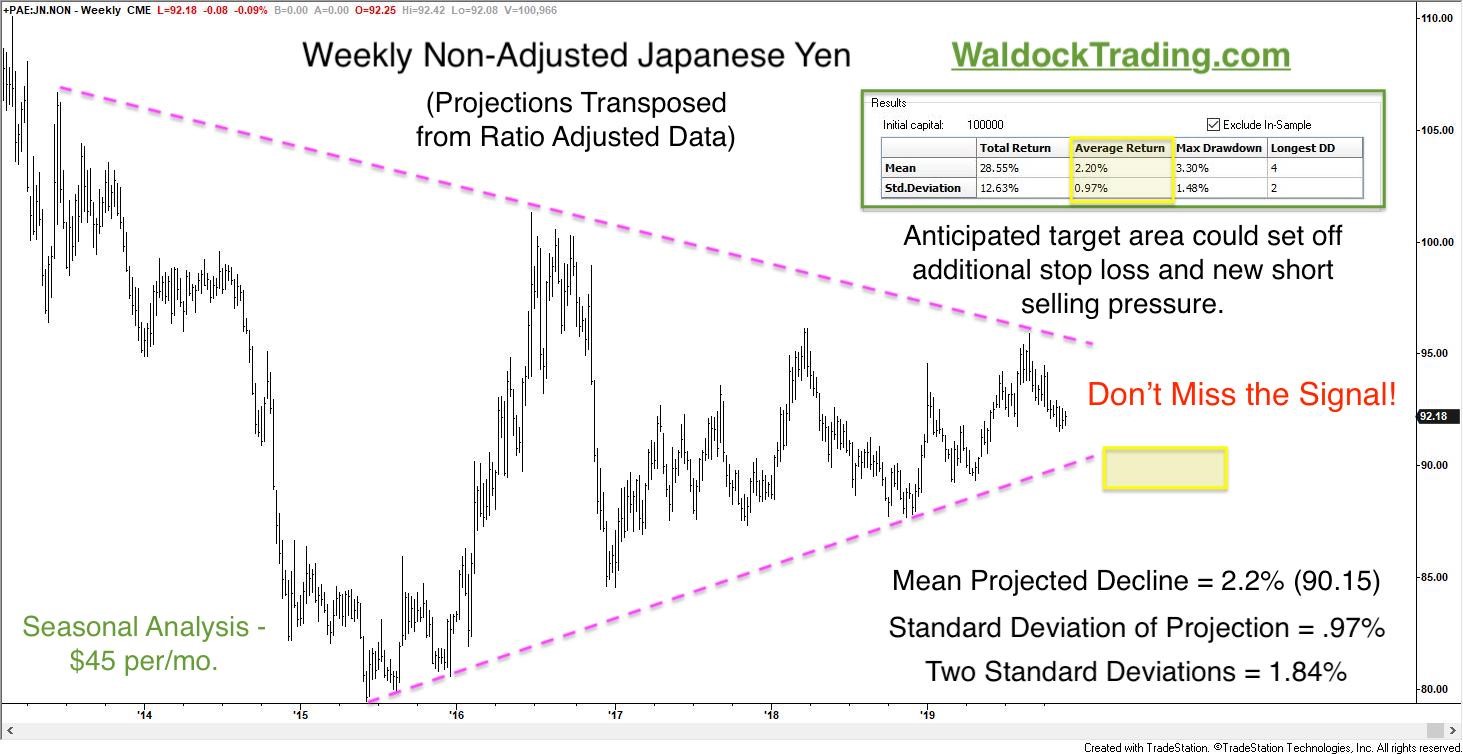
Forecasted seasonal weakness could trigger a breakout on the weekly Japanese yen chart.
Our modeling has provided us with the following out of sample results for this trade. Remember, while results are out of the sample, they are hypothetical. Of course, every seasonal commodity trade we publish is based on hypothetical results because we run new programs for each annual opportunity to take into account current market structure and volatility. That being said, commodity trading can be risky, and even though we always trade with active stop-loss orders, trading should only be undertaken with actual risk capital.
First, the hypothetical walk-forward results of the model we’ll employ (below).
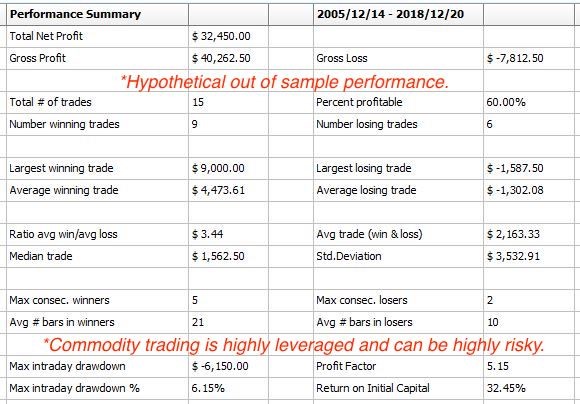
We create a new model for each seasonal opportunity. therefore, all results are hypothetical.
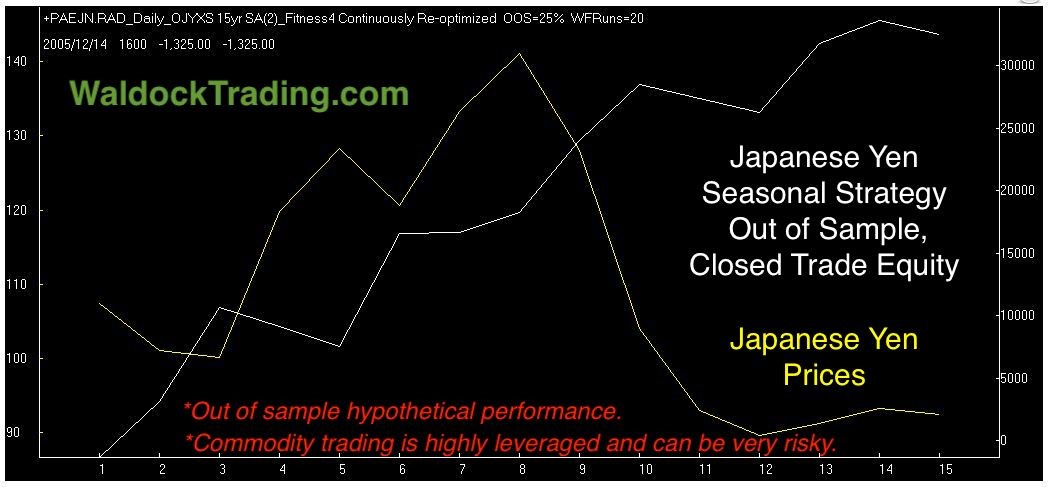
The hypothetical trade-by-trade walk-forward equity curve is next.
Don’t miss the next signal. Subscribe at WaldockTrading.com.
We always close with the Monte Carlo simulation data. As mentioned earlier, we build a new model with each trade. We do this to address the small sample size of an annual event. Since we can’t create more years, and seasonality 30 years ago isn’t the same as seasonality today, we focus on the last 15 years and allow the computer to randomize our entry and exit dates over a given range. We use this information to try and find the sweet spot of 100,000 tests.
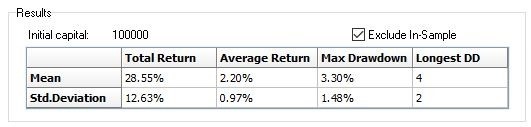
Out of sample Monte Carlo results provide a much fuller picture than 15 annual events taken on a single timeline.
Now, let’s compare the historical results to the Monte Carlo results. Historically, we expect a decline of 2.6% two-thirds of the time. That, in itself, is an edge worth trading. However, using the Monte Carlo analysis, we can create an out of sample forecast based on 100,000 timelines. These tests suggest that a more realistic expectation is a decline of 2.2% +/-.97%, two-thirds of the time based on the mean decline and standard deviation.
The historical and Monte Carlo analysis both forecast sufficient weakness in Japanese yen to force it through the lower boundary that has supported the market since mid-2015. We think a breakout could attract new selling as the market chooses a direction, and traders take notice.
Subscribe to receive our sell signal, protective stop level, and position management commentary (including exit) once the trade is triggered. Register at WaldockTrading.com for access to back issues. Here is what Andy had to say about seasonality and the COT Report at the TradersEXPO New York. Visit Andy Waldock Trading to learn more. Register and see our daily and weekly signals archive for entries and stop loss levels sent to our subscribers.


