
The E-mini S&P 500 is breaking above the top of the weekly bull channel and it is near the top of the monthly bull channel, writes Al Brooks.
Since the daily and weekly E-mini S&P charts are overbought, there will probably be a brief pullback within a couple weeks.
The monthly S&P 500 E-mini futures rallied strongly in November after gapping above the October high (see chart below). Gaps are rare on the monthly chart. Small gaps and gaps late in bull trends typically close within five to 10 bars. Therefore, traders should expect a pullback to below the October high at some point within the next year.
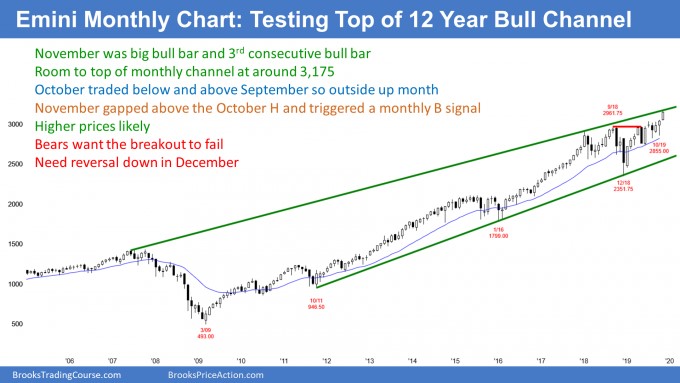
However, the bull trend is strong. The top of the 12-year bull channel will be just above 3173 in December. That is a magnet above. The E-mini is close enough so that it probably cannot escape the magnetic pull. Traders should expect the E-mini to get there within a couple months and maybe this year.
Importance of monthly trend lines
It is important to understand that every bear trend since the Depression reversed up from a dip below a monthly bull trend line. A bull trend is the bottom of a bull channel. The E-mini is near the top of the bull channel. What will traders expect if the E-mini goes above the top of the channel? They should expect a reversal down.
How far down? The goal is a test of the bottom of the bull channel. The bull trend line is now just below 2600.
Reversals at the top and bottom of channels usually come after overshoots. Therefore, a reversal down will probably only come after the E-mini goes at least 20 to 50 points above the top of the monthly channel. It usually begins within five bars (here, months) of breaking above the channel.
Does the reversal have to reach the bottom of the channel? No. Very often, a reversal goes sideways to down for two or more legs to the middle of the channel. The bull trend at that point frequently resumes back up. That means that the middle of the channel is the minimum goal if there is a reversal down.
What about an island top?
If there is a gap down at any point, it would create an island top with the November gap up. I don’t ever remember seeing an island top on the monthly chart in my 33 years of trading.
Also, island tops and bottoms are typically minor reversal patterns. While the bears might get a few bars (months) down, they should not look at an island top and expect a bear trend. They eventually will get one, but the island top would not be the major force behind it.
The E-mini S&P 500 futures have not had a pullback in nine weeks on its weekly chart (see below). A nine-week bull micro channel is a sign of strong bulls. They have been aggressively buying above the low of the prior week for two months. Traders should expect the bulls to buy at and below this week’s low if they get a chance.
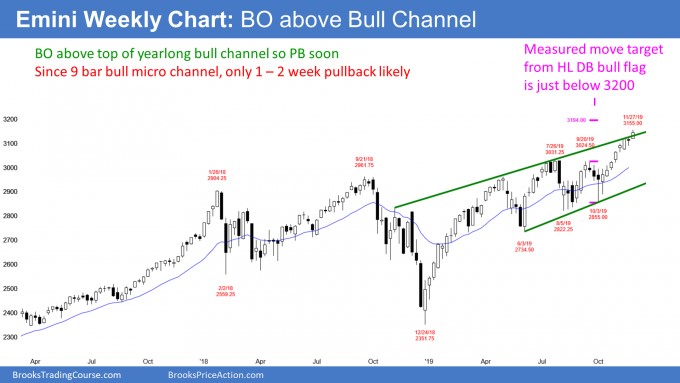
However, a micro channel is unsustainable and therefore a buy climax. As the E-mini gets further above the protective stop of the bulls (now, the Oct. 3 low), the bulls at some point will need to reduce their risk. The easiest way is to take some profits. That profit taking will cause a pullback. But because other bulls are eager to buy the first pullback, it will probably only last a week or two.
Last week was the first bear bar in seven weeks. It increases the chance of another bear bar within a few weeks. This week’s candlestick has a noticeable tail on top, which means traders sold into the end of the week. This is another sign of exhausted bulls. But because the bull trend is so strong, traders are not looking for more than a one- to two-week pullback.
Eventual evolution into a trading range
Once the E-mini begins to form pullbacks, the bears will begin to sell the next new high. Also, the bulls will become quicker to take profits. Some will switch from buying above the high of the prior bar to buying pullbacks. Additionally, they might start to take profits at a new high.
If enough traders make this change, the strong bull trend will stop going up and begin to go sideways. If so, the bears will become more willing to short and the bulls will be more willing to greatly reduce their position size. This could result in a swing down for several weeks. But most traders will want either a double top or a micro double top before there will be more than a couple weeks down.
The E-minis has been in a Small Pullback Bull Trend for two months on its daily chart (see below). How far up can this strong bull trend go over the next month? The top of the channel on the monthly chart is a possible target.
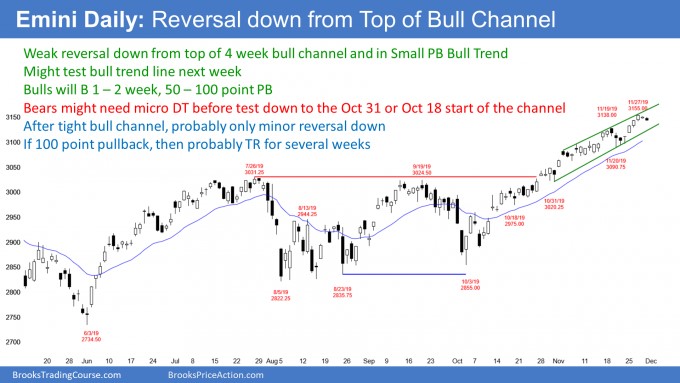
But since the buy climax is extreme, Friday might be the start of a minor reversal down. The first target is the bull trend line. If the bears break below that, then the next target is the start of the bull channel. That is either the Oct. 18 or 31 low.
A tight bull channel does not typically instantly reverse into a bear trend. Traders know that most bear trends begin with some kind of double top. Consequently, the bulls will buy the reversal down, even if it is more than 100 points. The best the bears can probably get over the next month is a trading range and not a bear trend.
3 different bull channels
There are different bull channels on the daily, weekly, and monthly charts. Each has a different starting point and the tops are each at a different price. The one on the daily chart began with the Oct. 18 low. The weekly bull channel began in November 2018, and the E-mini broke above it two weeks ago. Finally, the monthly bull channel began in 2007. Its top is around 3173.
The E-mini will probably have to go above all three before there is more than a 5% correction. Traders should therefore expect higher prices over the next couple months. This is true even if there is a 100-point correction first.
Don’t forget last December
Markets like symmetry. They tend to repeat behavior, like in Leg 1 = Leg 2 measured moves. They sometimes create the exact opposite of what just happened. It is common to see a big bear bar after a big bull bar and vice versa.
Do you remember what happened last December? There was a huge sell climax and then a tremendous reversal up. This year is ending with a huge rally, which is the opposite of last year. That does not mean that the E-mini will have a huge selloff and create the mirror image of last year. But it does slightly increase the odds. Consequently, if a strong reversal down begins, the bulls should make sure that there is a credible buy signal before buying.
Trading Room
Traders can see the end of the day bar-by-bar price action report by signing up for free at BrooksPriceAction.com. I talk about the detailed E-mini price action real-time throughout the day in the BrooksPriceAction.com trading room. We offer a two-day free trial.


