
Gold futures are sitting on some interesting chart patterns that appear ready to breakout of, reports Suri Duddella.
Gold Futures represent the benchmark futures contract for gold prices. Gold futures are hedging tools for commercial producers and gold users. Gold futures are widely viewed as a safe-haven asset in times of uncertainty and primarily used for portfolio diversification or alternative to investing in gold bullion/coins or gold mining stocks. Gold futures do offer great liquidity/options trading and are very responsive to world events/market conditions. Here are some recent and evolving chart patterns and trends.
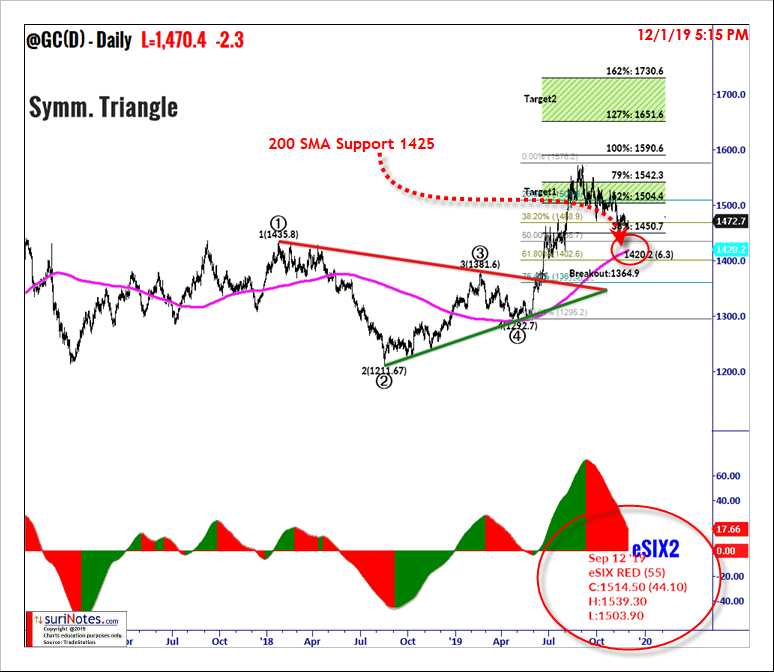
Symmetric Triangle Pattern
Symmetric triangles can be characterized as areas of indecision. Market price-action pauses during these indecision periods as the forces of supply and demand nearly become equal. Volume tends to be diminished during this consolidation phase. Eventually, a resolve (breakout or breakdown) from the upper or lower trend lines will result and prices will explode out the Symmetric triangle.
Usually, Symmetric triangles break in the direction of its prior trend, hence signifying its 'Continuation Patterns' status. Please note that there are many cases where Symmetric triangles result in a reversal pattern also after its initial breakout in the opposite direction, giving the trader the opportunity to trade the failure side of the pattern.
Gold traded side-ways since 2016 between price ranges of $1,150 to $1,450 and in 2019 Gold (Daily) formed a Symmetric Triangle. In July 2019, Gold broke out of its Symmetric Triangle pattern to rally to $1,573. Gold's Symmetric Triangle breakout was at $1,365 with its first target set at $1,504 to $1,542 and the second target is at $1,651 to $1,730. Gold rallied 11.6% in 2019 compared to 4.4% down in 2018. Currently Gold is trading in a retracement mode after reaching its first target.
Currently gold retraced 42% from the peak of $1,573. Gold may be forming an ABC Bullish pattern near 50% to 62% retracement range ($1,402 to $1,435) and may see support near 200-day simple moving average ($1,425). Its second target of Symmetric Triangle target range is $1,650 to $1,730 (see chart).
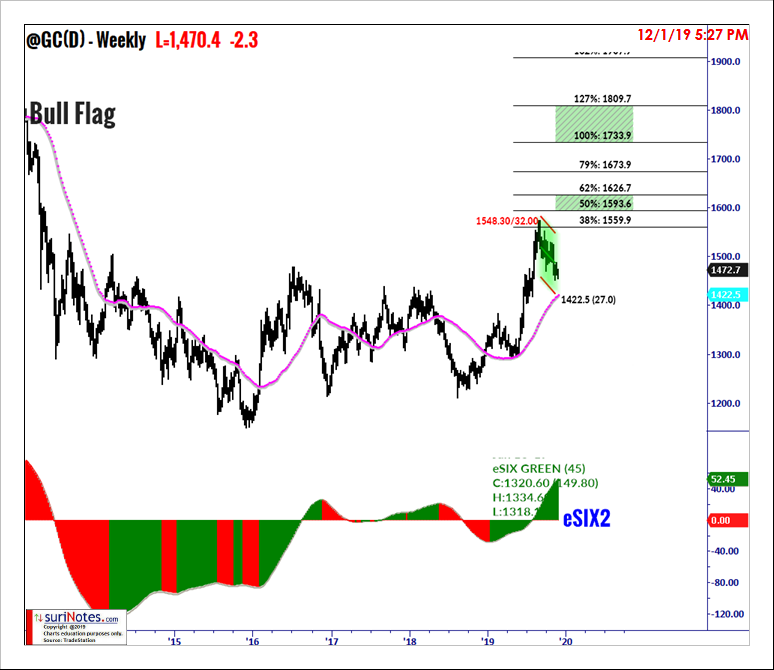
Gold's Bullish Flag Pattern
Bullish flag formations are formed in strong uptrends. Bullish flags resemble a flag on a pole with a downward slope. Once the price completes the pattern and breaks out of its consolidation range, Bullish flags result in a powerful move higher, measuring the length of the flagpole.
Gold's weekly chart is forming a Bull Flag pattern in a strong uptrend. Gold reached a peak of $1,573 in August 2019 from a low of $1,290 in May 2019. Since August 2019, gold has retraced 42% to form a bull flag pattern. The gold flagpole length is $275. Once gold breaks out of its bullish flag pattern, it is expected to rally $275 from its breakout level ($1,550 level). Gold's Bull flag targets are $1,593 to $1,626 and then $1733 to $1,809 (see chart).
 \\
\\
Find more of Suri’s work at surinotes.com.


