
The computer hardware sector has outperformed all other stock sectors in 2019 and several components have intriguing chart patterns, reports Suri Duddella.
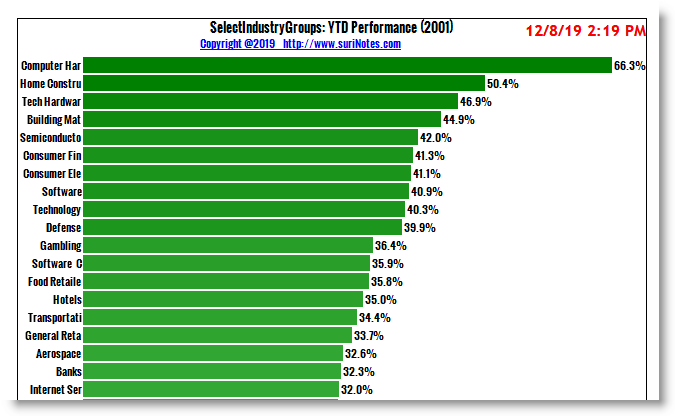
The Computer Hardware Group ranks as the best-performing industrial group among the select industrial groups in 2019. Computer Hardware group went up by 66.3% in 2019 compared to the worst-performing industrial group, coal, which fell 66.4%.
Computer Hardware includes physical and tangible parts of a computer, like CPU, peripheral, monitors, keyboards, storage, graphics cards, sound and motherboards. The other best performing industrial groups are Home Construction, Building Materials, Semiconductors, Consumer Finance, Software and Technology sectors (see table below).
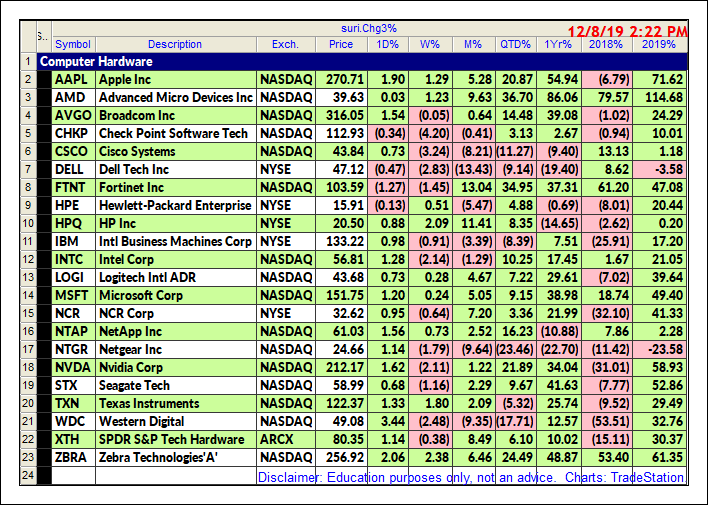
Some of the best-performing stocks in the Computer Hardware group in 2019 are Advanced Micro Devices Inc. (AMD) up 114.68%, Apple (AAPL), up 71.62%, Zebra Technologies Corp. (ZBRA), up 61.35% and Nvidia Corp. (NVDA) up 58.93% (see table below).
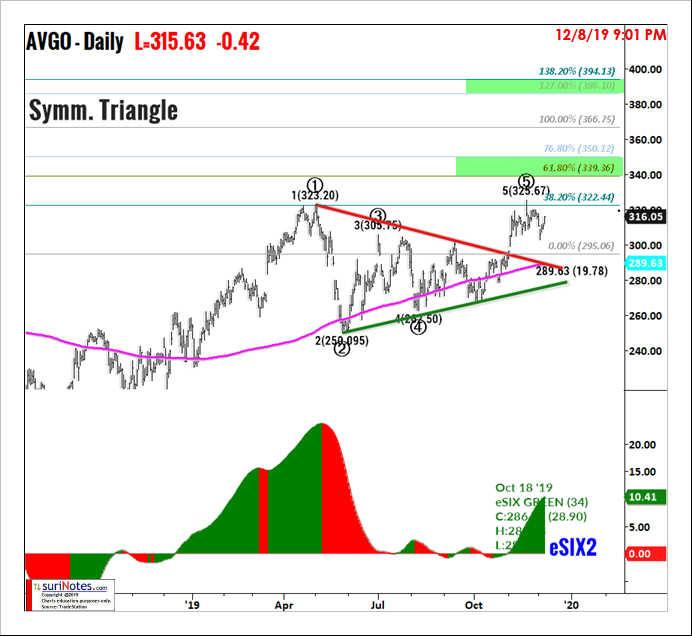
AVGO Symmetric Triangle Pattern
Symmetric triangles can be characterized as areas of indecision. Market price-action pauses during these indecision periods as the forces of supply and demand nearly become equal. Volume tends to be diminished during this consolidation phase. Eventually, a resolve (breakout or breakdown) from the upper or lower trend lines will result and prices will explode out the Symmetric Triangle. Usually, Symmetric Triangles break in the direction of its prior trend, hence signifying its continuation pattern status. Please note that there are many cases where Symmetric Triangles result in a reversal pattern also after its initial breakout in the opposite direction, giving the trader the opportunity to trade the failure side of the pattern.
The following chart shows AVGO Daily chart with Symmetric Triangle formation with eSIX trend indicator. Broadcom Inc. (AVGO) formed a Symmetric Triangle pattern from April 2019 until November 2019 between $250 and $323. In the first week of November, AVGO traded above the upper trend line of the Symmetric Triangle (above $295) to signal a breakout trade. A long position is entered above $295 with the first target set at $339 and the next target is set at $386 (see chart).
INTC's Rectangle Channel pattern
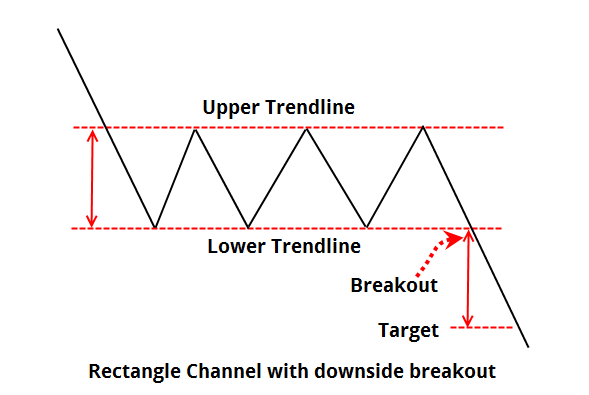
Rectangle Channel patterns are formed by price action between two key trendlines bound by multiple equal (near) highs and lows. The duration of the pattern can be few days to months. Longer duration patterns are considered to be more reliable. The pattern must have at least two pivots (equal highs or equal lows) on each of the trendlines. The price breakout can occur in any direction from the pattern, but the general belief is price may breakout in the same direction as prior direction before the pattern formation. The volume inside the pattern is non-decisive, but volume tends to increase during the breakouts.
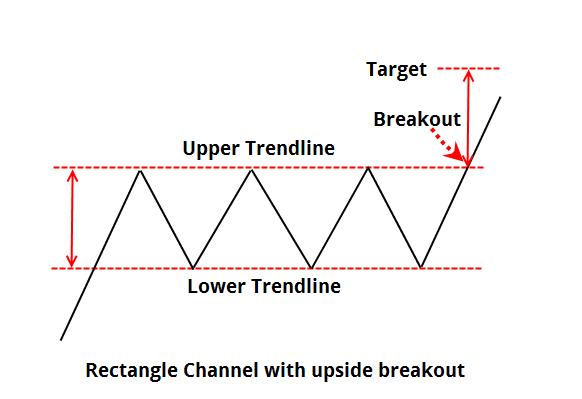
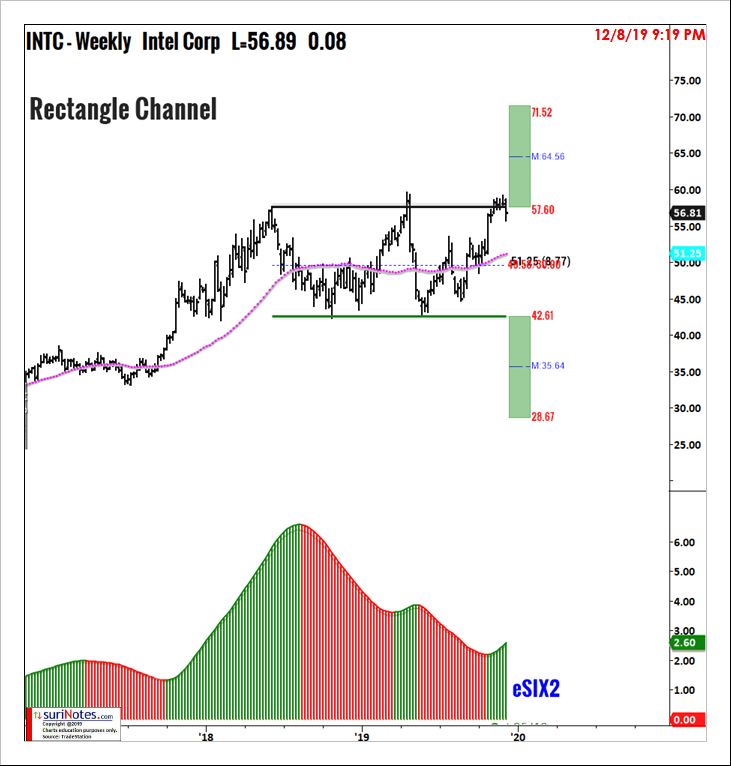
The following chart shows Intel Corporation's (INTC) weekly chart. INTC's weekly chart formed a rectangle channel pattern from January 2018 to December 2019 between $42.51 to $57.60. INTC price closing above $57.60 would signal a breakout for a long entry. The first target range would be $64.5 to $71.5.
Find more of Suri’s work at surinotes.com.


