
As we close out not only another year, but the current decade, the E-mini S&P is nearing important technical benchmarks, reports Al Brooks.
The E-mini S&P 500 is closing out the decade at a new high after opening the decade near its low. This increases the chance for a couple weeks of profit-taking in early January, or possibly beginning on Monday. However, Thursday might gap up. If it did, there would then be a gap on the monthly, yearly, and decade charts!
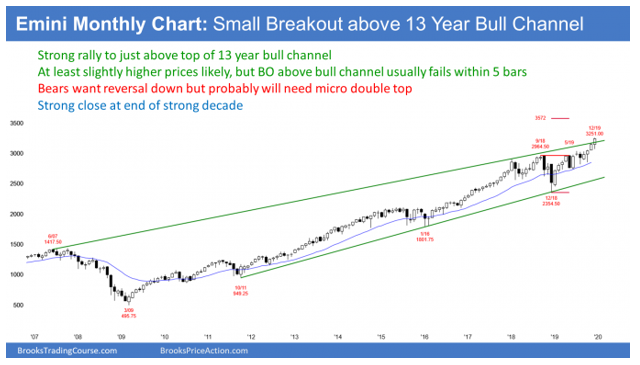
The E-mini S&P 500 E-mini futures is forming its fourth consecutive bull trend bar on its monthly (see below). With only two trading days left in December, the month will probably close near its high. The yearlong rally has been a resumption of the strong bull trend that ended with a buy climax in January 2018.
That was the most extreme buy climax on the monthly, weekly, and daily charts in the history of the stock market. I talked about that often in late 2017. The result was exhausted bulls. But after a year of sideways trading in 2018, they again bought aggressively throughout 2019, creating trend resumption up.
How far can this rally go? The first target traders always consider is a measured move. The two-year trading range was about 600 points tall. A measured move up is 3,575.
Will the E-mini get there? It might, but it could take more than a year.
What could go wrong?
There are several hurdles ahead. First, the inverted yield curve in August is a reliable predictor of a recession. The recession typically starts one to two years after the inversion. Since the stock market usually sells off about six months before a recession begins, the bulls might not have enough time to reach the measured move target.
Also, this is the longest bull trend in the history of the stock market. That reduces the chance of it lasting several more years.
Additionally, a trading range late in a bull trend is usually the Final Bull Flag. That means that traders should expect a reversal back down into the two-year trading range before too long.
The breakout often continues for 10 or more bars before the reversal begins. Ten bars on the monthly chart is about a year. Again, there might not be enough time to reach 3,575 before then.
Finally, the monthly chart is breaking above a bull channel. There is typically a 75% chance of the start of a reversal back down before about five bars (months). If there is a reversal, the minimum target is the middle of the channel. If the correction continues below that, the next target is the bull trend line at the bottom of the channel.
10-year Trading Range?
I want to make one final point about the unusually strong and long-lasting bull trend. The bulls always keep buying until they are confident that the price is clearly far above what the fundamentals would dictate.
They then start to take profits and wait until the fundamentals catch up to the price. They need to see the market go sideways to down for a long time before they conclude that it is once again cheap. That sideways to down trading means that the bull trend evolved into a trading range.
The legs in a trading range on the monthly chart can be huge and last a year or more. Look at what happened after strong rally in the late 1960’s and the one in the late 1990’s. Both led to a decade of sideways trading. Furthermore, each trading range had two or more selloffs of at least 40%. The selloff in 2009 was 60%.
There is no top yet and the E-mini could go higher for a year or more. However, traders should expect the trading range to begin within three years. Once it does, traders should look to buy 30% to 50% selloffs and take profits on 50% to 100% rallies for the next decade.
Strong bull trend on yearly chart
Tuesday is not only the final bar of the month and year; it is also the end of a very strong decade. Think about a yearly chart for a moment where every bar is one year;2019 is a huge bull trend bar. A huge bull bar on any timeframe often attracts profit-takers. There often is a pause on the next bar.
For example, the next bar could be an inside bar. When the next year opens on Wednesday, if the open is below this year’s high, traders might wonder if 2020 will be an inside bar on the yearly chart. If enough think so, then the year would be opening near the high of the coming year. Traders would look for an early selloff, and then sideways to lower prices all year.
Alternatively, next year could go above this year’s high, but close at or below this year’s high. If 2020 closed on the low, it would be a sell signal bar on the yearly chart. That would increase the chance of lower prices in 2021.
If it closed around the middle, it would be a doji bar. That is neutral and it would make more sideways trading likely in 2021.
Markets constantly probe. They try to do things that have never been done before. They look for extreme behavior to see how traders will respond. For example, buy and sell climaxes can be extreme. Look at the 1929 Crash and the 2017 buy climax. Both were the most extreme in history.
What if next Wednesday gaps up to a new all-time high? There would be a gap up on the monthly chart, like in November. Gaps on the monthly chart are rare.
However, there would also be a gap up on the yearly chart. I doubt there has ever been a gap up on the yearly chart that has stayed open. I did not check, but there might never have been a gap up on that chart.
Finally, consider a decade chart where each bar is one decade (not shown). A gap up to a new high on Wednesday would create a gap up on that decade chart!
I doubt that has ever happened. If it did, it would probably close before the end of the bar. But the bar closes 10 years from now. Therefore, a gap up next Wednesday could stay open for several years.
Exhaustion gap or measuring gap?
A gap up late in a bull trend usually closes within a few bars. For example, the gap above October’s high will probably close within the next six months.
However, sometimes the gap stays open for a long time and becomes a measuring gap. It could be a measuring gap on the daily or weekly charts and an exhaustion gap on the monthly, yearly, and decade charts.
For example, it could lead to a rally lasting several months and reaching some measured move target on the weekly chart. Then, if there was a reversal over the next many months, the selloff could close the gap. The gap would then be an exhaustion gap on the monthly, yearly, and decade charts.
In any case, you will never see this type of price action again in your trading career. Gaps up on the monthly chart are rare. They may never have happened on the yearly and decade charts and will probably not happen again in your lifetime. It will be interesting to see what follows.
Parabolic wedge top on the yearly chart
If you look at a yearly chart (below) where each bar is one year, you will notice that the past decade had several breakouts. Each one was followed by a pause. That is a parabolic wedge buy climax and it typically attracts profit-takers. This is especially true when a bar is the biggest bull bar late in the trend, like 2019. Ordinary profit-taking usually results in a one to three bar pullback. Since this is a yearly chart, a pullback could easily last more than a year.
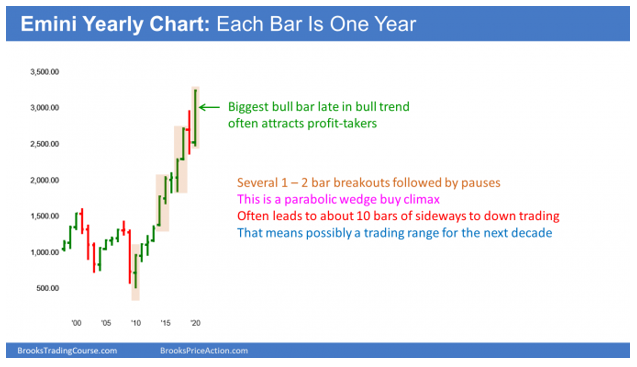
But this is a parabolic wedge buy climax. When it ends, there is often about a 10-bar sideways to down pullback before the bull trend resumes. That is a decade, and it is consistent with what I just wrote above. After a parabolic wedge buy climax, the market often goes sideways for about 10 bars. That means the next decade could be a trading range.
The E-mini S&P 500 has rallied strongly for four months on the weekly chart (below). However, last week was a small bar with prominent tails. It is relatively neutral, which means a loss of momentum. That is often the first sign of impending profit-taking.
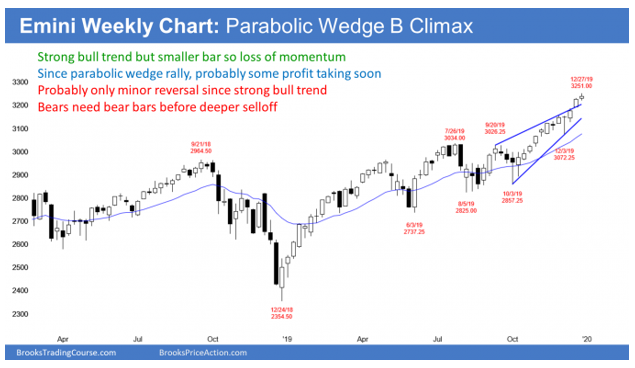
Because the bull trend is so strong, if there is profit-taking, it will probably lead to a bull flag or a trading range and not a bear trend. A strong bull trend usually needs at least a micro double top before a bear trend can begin.
I mentioned four weeks ago that the big doji buy signal bar was a problem. Yes, it was the first pullback in a nine-bar bull micro channel. Traders expected at least slightly higher prices.
But the big tail on the bottom of a doji bar means that there was strong selling early in that week. That increases the chance of additional selling soon afterwards.
When a doji bar is the buy signal bar in a buy climax, the rally usually has more profit-taking within a few bars (here, weeks). Last week’s small bar might be the start. Therefore, there is an increased chance of a one- to two-week pullback beginning within the next couple weeks.
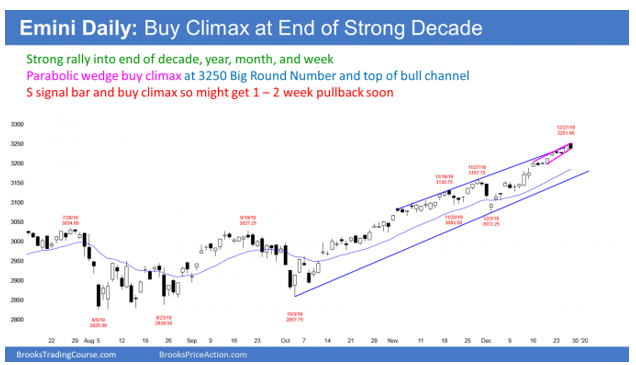
The daily E-mini futures chart was in a tight trading range for three days but resumed up at the end of last week (see below). Christmas week is usually the quietest week of the year, but there typically is at least one strong trend day, like Thursday or Friday. The daily ranges tend to be small and big moves are the exception. With New Year’s being in the middle of the week, this week will probably also be quiet.
Markets pay attention
Markets often repeat behavior or do the opposite of recent behavior. Last December crashed and January reversed up. The rally began on December 26, 2018.
This December is crashing up. That increases the chance of an attempt of a reversal down in January. Friday is a sell signal bar for a parabolic wedge top on the daily chart. It is at the top of a two-month bull channel and at the 3250 Big Round Number. Finally, Friday was Dec. 27. That is only one day after last year’s trend reversal.
If the bulls take profits here, traders will expect a brief pullback. There is no strong top yet. Tight bull channels do not typically immediately reverse into bear trends without first going sideways for at least a few bars. The best the bears will probably get is a 10-bar tight trading range or bear leg in a broader trading range. Then traders will decide if the selloff is a pullback or the start of a bigger reversal.
The January Barometer and the January Effect
The news always talks about the great predictive power of January’s performance. You will hear them talk about the January Barometer. If January is up, the rest of the year has an 82% chance of being up.
But remember, the world’s population has constantly increased, as has productivity. That means the world’s wealth continues to increase. The result is that the stock market on a yearly chart has never been in a bear trend. In fact, 65% of all months are up. If there is a strong January, the market has an 82% chance of being up for the remainder of the year. That is not much different from 65%, and it is not different enough to change your trading behavior.
The January Effect means that the bulls who sold stock in December for tax reasons will buy stock in January. That theoretically can lead to a January rally. However, most months are up about 0.5% to 1.5%. January is no different. Also, with the year ending strong, there might be some profit-taking in January.
What will happen? Who cares? I will trade what I see, not what the news tells me will happen. Therefore, traders should view all of this as having only entertainment value. Listen to it and smile. Just understand that no one makes money trading based on any of these concepts.
Trading Room
Traders can see the end of the day bar-by-bar price action report by signing up for free at BrooksPriceAction.com. I talk about the detailed E-mini price action real-time throughout the day in the BrooksPriceAction.com trading room. We offer a two-day free trial.


