
While the U.S. Strike has risen the threat of retaliation and broader geopolitical risk, it could boost Aerospace and defense stocks. These three are ready to breakout, reports Suri Duddella.
Following the U.S. airstrike that killed Iranian General Qasem Soleimani, U.S. Defense and Aerospace stocks started to rally as investors expect Middle East conflict could escalate and defense spending could see a boost in 2020. In 2019, the SPDR S&P Aerospace & Defense Select ETF (XAR) returned 38.25% compared to the broad S&P 500's return of 28.8%. During the election year, U.S. Defense stocks usually outperform the S&P 500. This could interest investors to look into Aerospace & Defense stocks.
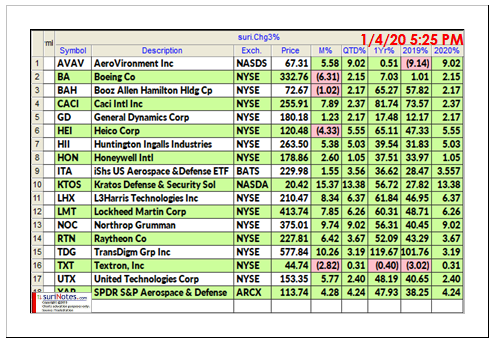
Below is a list of Aerospace and Defense stocks and their performances in 2019 & 2020.
Aerospace & Defense stocks exhibiting Cup & Handle pattern
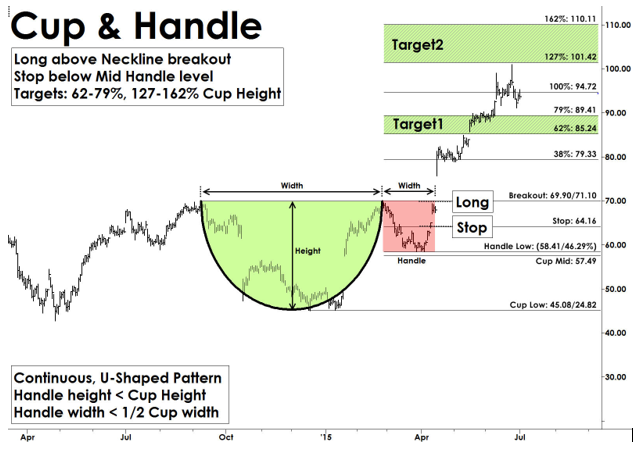
The Cup and Handle Chart pattern was developed and popularized by William J. O’Neil in the 1980s through his CANSLIM methodology. This methodology was described in Investor’s Business Daily newspaper and his book "How to Make Money in Stocks."
The Cup & Handle Pattern simply resembles a cup with a handle. The Cup & Handle is a continuation pattern that usually forms bullish trends. Most Cup & Handle Patterns are very reliable and offer great trading opportunities. They also form in all markets and in all time-frames. The “Cup” formation is developed as consolidation phase during price rallies from the round bottom formation over multiple weeks to months. The “Handle” part forms due to a price correction after the “Cup” formation and before a clear breakout to the upside.
The Cup & Handle pattern structure shows the momentum pause after reaching a new high in a U-Shape form, followed by another attempt to breakout. When this breakout from the rim of the cup fails it starts to fall back to build the handle structure. Usually, the handle structures are small, and the handle depth should not exceed more than 50% of cup depth (see chart below). This handle part of the pattern generates interest in buyers as they expect the pattern to breakout from these levels. The pattern is valid only if price convincingly breaks out with increased volume above the rim of the cup levels.
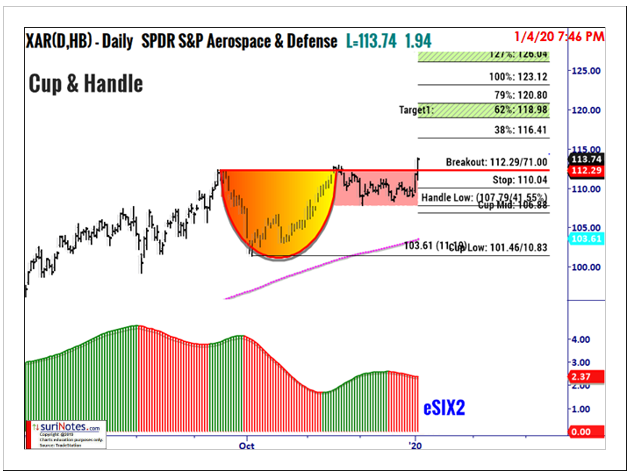
SPDR Aerospace & Defense ETF (XAR) chart formed a Cup & Handle pattern on its daily chart between September 2019 and November 2019 between $101.46 to $112.29. From November until Jan. 2020, XAR formed the handle part. On Jan. 3, 2020, XAR closed above the breakout level ($112.29) to signal a long setup. Price Targets are set at $119-120.80 with a stop below the Handle low $107.75 (see chart).
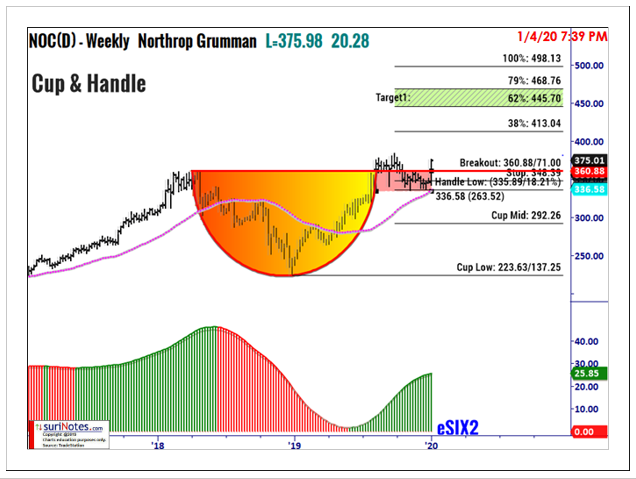
Northrop Grumman Cup & Handle Pattern
Northrop Grumman (NOC) formed a Cup & Handle Pattern between January 2018 and June 2019 on its weekly chart from $223.63 to $360.88. Since June 2019, it traded sideways to build the handle part of the pattern. Last week, NOC closed above the breakout level ($360.88) to signal a long setup. First target ranges are set at $445-468 with a stop below the Handle low ($336).
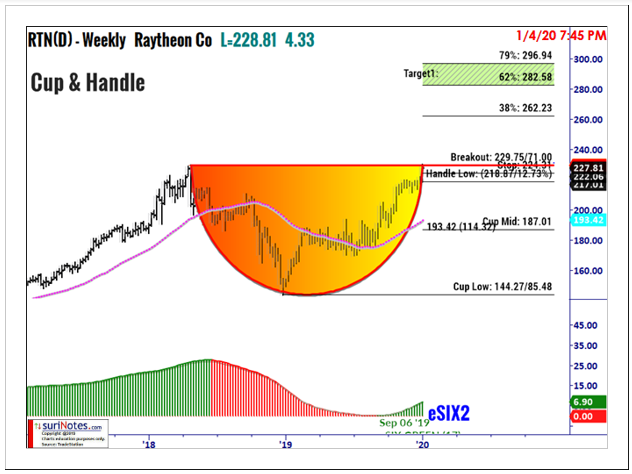
Raytheon Cup & Handle Pattern
Raytheon Co. (RTN) is forming a Cup & Handle Pattern between $144.27 and $229.75 on its weekly chart. Currently, RTN just completed the cup part the pattern. Cup & Handle patterns need to form a handle before they fully breakout to reach the next targets. On its breakout, the next targets are set at $282-296. Once the handle is formed, a Cup & Handle stop is placed below the handle-low.
Find more of Suri’s work at surinotes.com.


