
The January barometer shows a bullish market outlook, but with some storm clouds on the horizon, writes Kerry Given.
The S&P 500 Index (SPX) opened this first full week of the new year at 3218 and closed Jan. 10 at 3265, for an increase of 47 points or 1.5%. The January Barometer, was created by Yale Hirsch in 1972 and publicized in his Stock Traders Almanac, currently run by his son, Jeff Hirsch.
There are two parts of the January Barometer: trading results for the S&P 500 index over the first five days of January and then for the full month of January. The first five days were narrowly positive with the new year opening at 3245 and the fifth trading day, Jan. 8, 2020, closing at 3253 (see chart below). So now we anticipate the close in three weeks for the full January barometer forecast for the year. Both measures have success records of over 80% in predicting the direction of the market for the coming year.
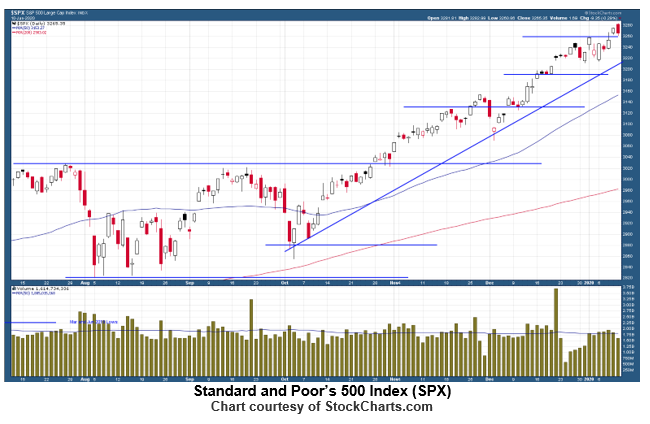
Trading volume remained weak, running roughly at or below the 50-day moving average all week. Trading volume fell off today almost like we were entering a three-day weekend.
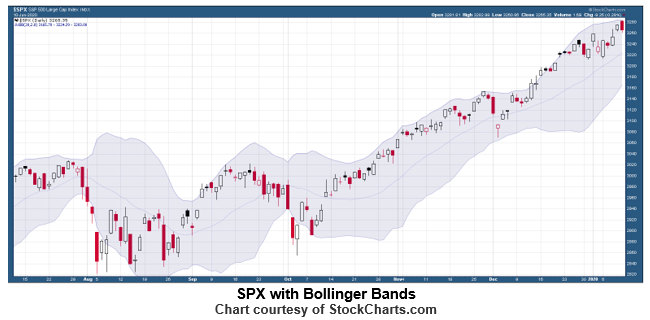
I have drawn the Bollinger bands on the SPX chart below with two standard deviations above and below the 20-day moving average. SPX has been running along that upper edge of the Bollinger bands since mid-October, but it has stalled twice, once in the first week of December and again for approximately the last week of trading (Dec. 27 through Jan. 7). On Jan. 10 the S&P 500 appeared to bounce off resistance at the upper edge of the Bollinger bands and pulled back to book a slightly negative day, down 0.3%.
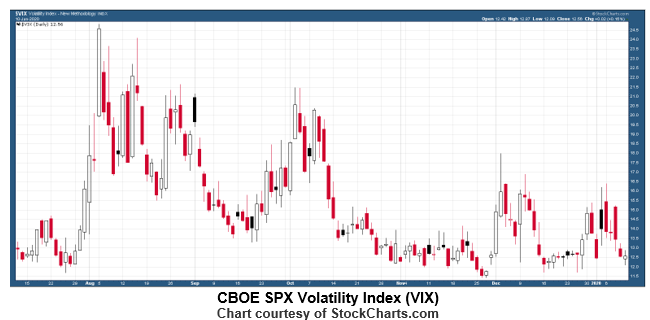
The Cboe Volatility In (VIX) opened the week at 15.5, and steadily declined to close on Jan. 10 at 12.5%. This suggests that the mood of the large institutional traders remains largely bullish.
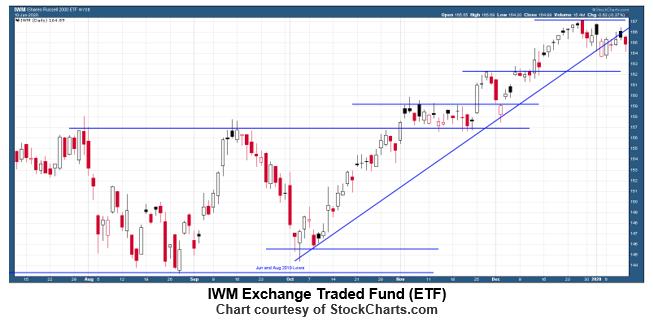
The iShares Russell 2000 ETF (IWM), the exchange traded fund based on the Russell 2000 mid-cap index, was weaker than SPX, opening the week at 163.85 and closing at 164.89, up 0.6% (see chart below). These are the high beta stocks that should be leading this bull market, but they aren’t. The bulls remain somewhat tentative.
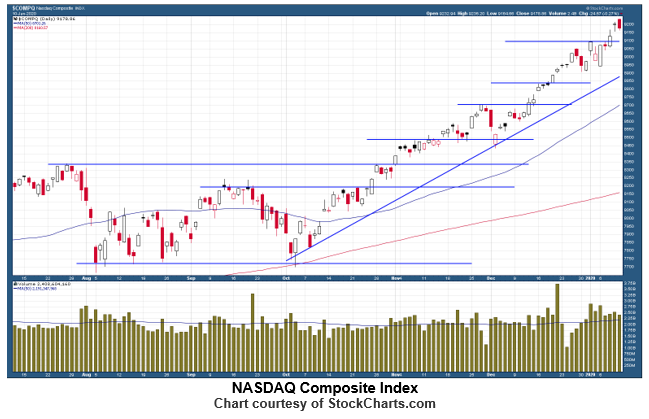
The NASDAQ Composite index set the pace for the bulls last week, opening at 8944 and closing at 9179, up 2.6% for the week, eclipsing the S&P 500 by a full percentage point (see chart).
NASDAQ’s trading volume was also stronger, running consistently above the 50-day moving average every day last week.
This market is undeniably strong. In fact, it is so strong that it unnerves many observers, and I feel some of that sentiment as well. It is interesting that the current crop of bears’ main argument is that the bull market has lasted too long. The economic data are strong, and the Fed remains committed to low interest rates.
I drew trend lines from early October through Jan.10 on the SPX, IWM and NASDAQ charts to make a point. Note that SPX and NASDAQ are trading well above that trend line. Even the recent hiccups during the last couple of days of December and first couple of days in the new year didn’t take either index close to that trend line.
But the IWM trendline is markedly different. Intraday trading on Jan. 2 touched the trend line but bounced higher. But the price action on Jan. 3 broke that trend line and IWM remained below the trend line. I consider this a shot across the bow of the bulls’ ship. The bulls are running, but that run is largely in the high-tech favorites, the FANG stocks: Facebook (FB), Amazon (AMZN), Netflix (NFLX), Google (GOOG) and others. You see that favor in the strong performance of NASDAQ versus the S&P 500. The high beta stocks that are members of the Russell 2000 and make up the IWM are trading sideways. These are the stocks that should be leading the bulls’ charge, but they aren’t.
My posture remains unchanged. I am bullish, but I also remain cautious. This week’s market largely ignored the sword rattling in the Middle East, but this market remains nervous. The large institutional traders will act quickly to preserve their profits. They will sell first and analyze their actions later.
Take advantage of the bullish run, but stay alert. Don’t get too euphoric.
Parkwood Capital, LLC, Learn more about The No Hype Zone Newsletter
Parkwood Capital, LLC


