
Stocks tend to perform well in a year they perform well in January, so let's take a look at the historical numbers, explains Rocky White of Schaeffer's Investment Research.
The January Barometer theory is that the first month of the year sets the tone for the rest of the year. The idea that one month of trading can create momentum for the next 11 months seems absurd, but the data behind the theory is substantial.
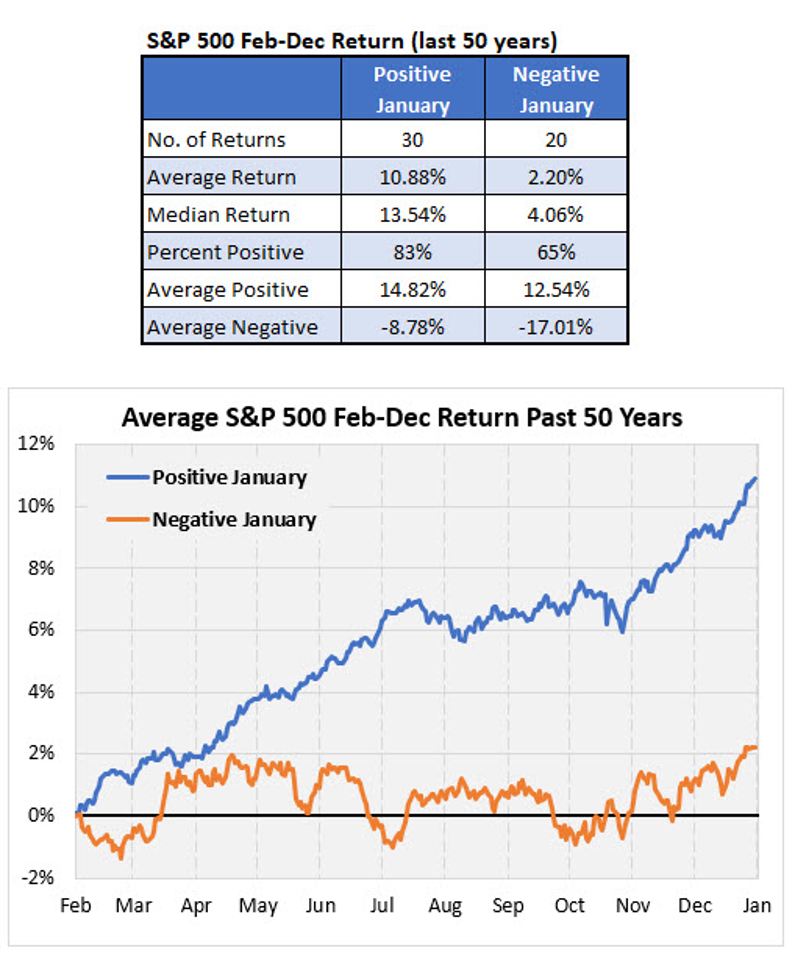
January Barometer Data
Below is a table summarizing the performance of the S&P 500 Index from February through December, depending on whether January was positive or negative. Stocks have performed far better after a positive first month compared to a negative first month. The chart accentuates how much better the rest of the year has performed when January was positive. After a positive January, the blue line shows stocks have tended to steadily move higher for the rest of the year (other than a lull from mid-July through mid-October). After a negative January, however, stocks on average have tended to chop around the breakeven level, gaining around 2% for the rest of the year.
January as a Short-Term Barometer
We know January has been a good indicator for the rest of the year, but what about the next month? How about for the rest of the first half? Again, the numbers make a good case that January can predict the future.
Over the last 50 years, when January was positive, February was positive 70% of the time, gaining 1.12% on average. When January was negative, the index fell an average of 0.82% the next month and positive just 40% of the time. The second table shows returns through the rest of the first half. Without difficulty, stocks again outperformed when January was positive.
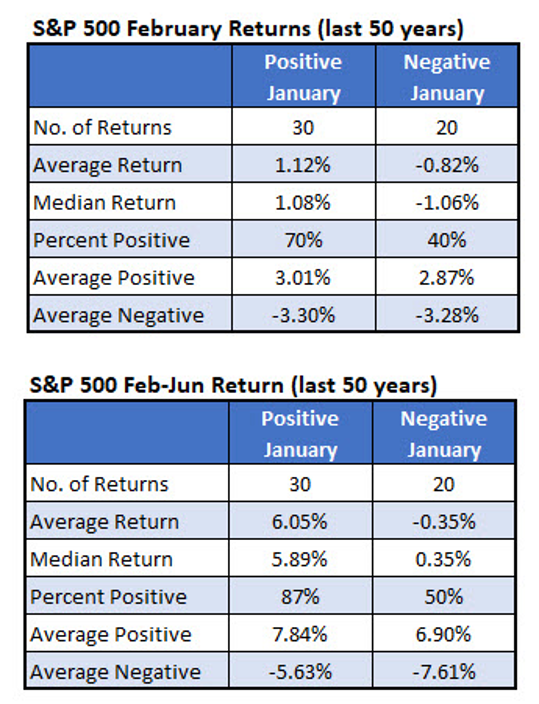
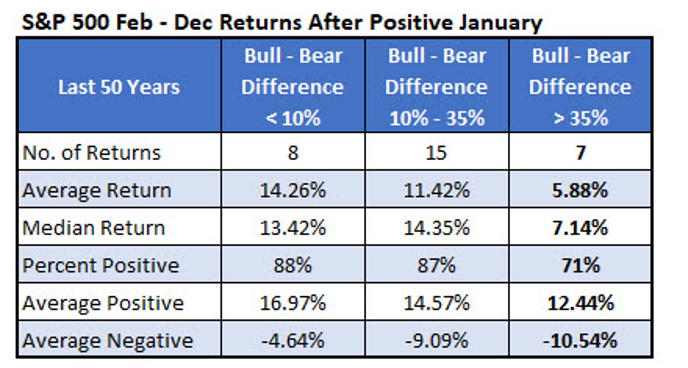
Chart Score as an Indicator
According to the weekly Investors Intelligence sentiment survey, there's a lot of positive sentiment already built into stock forecasts. The editors at Investors Intelligence gather more than 100 published stock newsletters and determine the percentage that are bullish and bearish on the market going forward (there's a third designation for newsletters that are short-term bearish but longer-term bullish). So far this year, the percentage of bulls have outpaced the bears by about 41%. So, sentiment is very bullish by this metric. As contrarians, we would expect this to have bearish implications going forward.
The table below summarizes the returns from February through December after a positive January, depending on the amount of bullishness or bearishness in the Investors Intelligence poll through the first month of the year. When there's significant optimism (defined here as a bull-bear spread of 35% or more), the S&P 500 averages a gain of just 5.88% for the rest of the year with about 71% of the returns positive. It's not a bad return for the next 11 months, but it's nowhere near the average double-digit gains with about 88% positive otherwise.
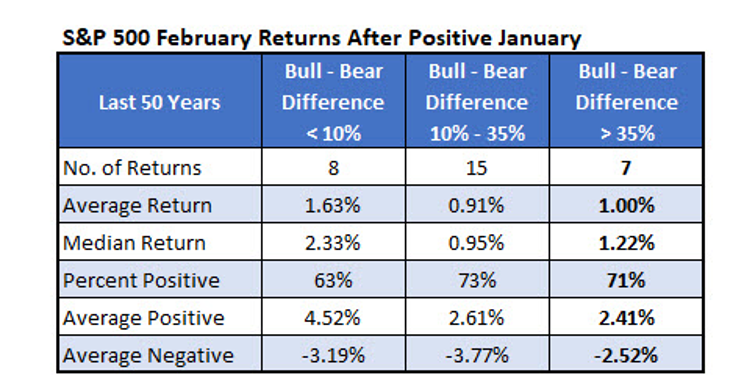
Looking strictly at the numbers, bullishness in the Investors Intelligence survey means less in the short term. February averages a 1% gain with 71% of the returns positive when there's significant optimism after a positive January. This is similar to what you see after any positive January.
Sign up here for the Schaeffer's Research Edge weekly newsletter.


