
Last week’s sharp sell-off is not over though traders can expect a relief rally, writes Al Brooks, who provides a long-term technical outlook.
There is a 30% chance that the E-mini S&P 500 correction will reach 30% to 50% before it is over.
Containment of the Coronavirus probably will not work. A vaccine is the realistic solution, but that is many months to a year away. This could be the worst pandemic since the 1918 flu, which killed 50 million people. (We will provide a more detailed analysis on this later this week; stay tuned).
The E-mini S&P 500 sold off strongly last week. Traders should expect a strong short covering rally this week and then a second leg down. Because the E-mini is so oversold, the rally could last several weeks and retrace more than half of the selloff. But it will probably then trade sideways to down for many months. There is a 50% chance of at least a 20% correction and a 30% chance of at least a 30% correction. The peak loss of the move was roughly 15% and the S&P closed around 13% off of its high.
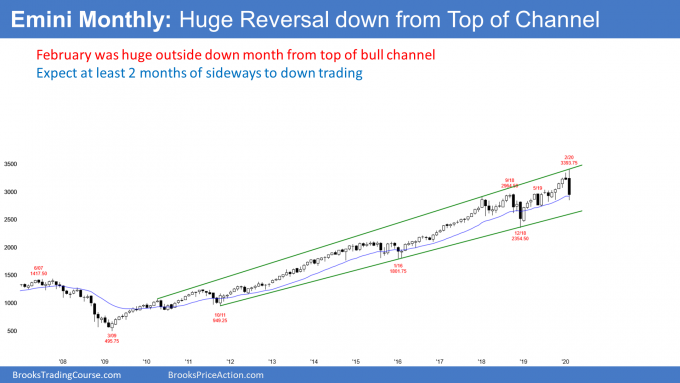
Two weeks ago, when the E-mini S&P 500 was above the January high, I wrote that there was a 30% chance of a strong reversal down to below the January low by the end of the month. That was based on January being a credible sell signal bar at the top of a 13-year bull channel and it was a bear doji (see monthly chart below). When there is a bear doji at resistance, the next bar often as a big tail on top as well. Therefore, traders needed to be open to the possibility of a sharp selloff at the end of February.
Obviously, the size of the selloff was a low probability event. When there is a low probability bear event, bulls are trapped into bad longs and many bears are trapped out of a good short. That means there is typically at least a small second leg down.
Expect at least 2 legs down on the monthly chart
There will likely be at least a small second leg sideways down on the daily chart after the first bounce, and maybe on the weekly chart. On the monthly chart, February is still only the first bar down from the high. The bears will need at least a few down months before traders will expect a second leg down on the monthly chart. That has not happened since the 2015 selloff, but it appears probable again this time. This is especially true, given the incipient pandemic.
There were many bear bars over the past two years. That is selling pressure and it increases the chance of lower prices. Also, the E-mini is late in a bull trend and at the top of the 13-year bull channel. Finally, February was a surprisingly big bear bar at resistance in a buy climax. These factors increase the chance that the E-mini might be sideways to down for many months.
Reversing down from the top
I wrote in December that the monthly chart was breaking above a 13-year bull channel. That created a 75% chance of a reversal within months. February is a good candidate for the start of a reversal.
What are reasonable downside targets when a market reverses from above the top of a bull channel? The E-mini fell below the 20-month exponential moving average Friday and it is now right at that level. It is back in the March to October 2019 trading range. It was stuck there for six months and it might stabilize here again for a month or more.
Remember, that we predicted the E-mini would be in a trading range this year between 2900 and 3500. So far, this selloff has fallen 16% and about 1% below my 2900 target.
There are also targets based on the bull channel. The obvious one is the bottom of the channel. That is the eight-year bull trend line and it is currently around 2600.
These targets are based on the technical factors. There is always a 30% chance of a much bigger selloff. That is especially true in light of the threat of an expanded Coronavirus pandemic.
What about March?
The E-mini formed a big outside down bar in February. Its high was above the January high and its low was below the January low.
An inside bar often follows an outside bar. Therefore, the March low might stay above the February low. If so, there would be an inside-outside-inside (ioi) pattern on the monthly chart. That is a Breakout Mode pattern.
However, the monthly chart turned down from the top of a 13-year bull channel. That reduces the chance of much higher prices over the next few months. But because the monthly bull trend has been strong, any selloff will probably end within a few months.
The month after a big outside down month often trades below the outside down month. But because February was extremely big and its low is in a support zone, March will probably not be a big bear bar on the monthly chart. There might be more buyers than sellers below the February low.
This is especially true since the February low is in the support of last year’s six-month trading range. If March trades below February and closed near its high, it would be a High 1 bull flag buy signal bar for April. However, February did significant damage to the bull case.
The weekly E-mini chart formed a huge bear bar this week. Last week was a Low 2 sell signal bar on the weekly chart (see below). When this week gapped down, it triggered the sell signal. This week is the entry bar. Since it had a big bear body, it is a strong entry bar. That increases the chance of lower prices over the next few weeks.
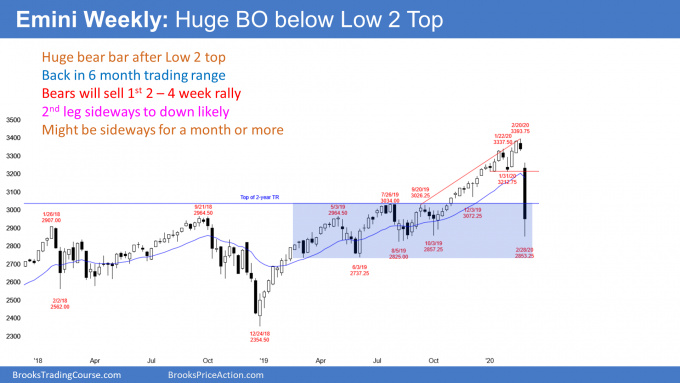
The E-mini broke below the 20-week exponential moving average and then below the yearlong bull trend line. A surprisingly big bear bar usually will have at least a small second leg down.
Sometimes a huge Bear Surprise Bar can be the spike in what will become a Spike and Channel Bear Trend. That means a trend that has at least three legs down. The spike is the first leg. There is no reversal yet and therefore the spike might grow into a two or three bar breakout over the coming weeks.
What about a bear trap? Can the E-mini reverse last week’s big bear bar this week? The bulls have a 20% chance of an immediate reversal up like after Christmas 2018. A huge selloff like this typically will have a sharp one- to three-bar (week) short covering rally. But the context and the size of last week’s bear bar make it much more likely that the E-mini will be sideways to down for at least another month.
If I am right about the Coronavirus pandemic, the charts could become much more bearish over the next couple months.
The daily E-mini chart collapsed last week. It broke below the 3000 Big Round Number and the top of the two-year trading range (see below). The low was also more than a measured move down from the two-month trading range. Furthermore, the low was a 16% correction from the high.
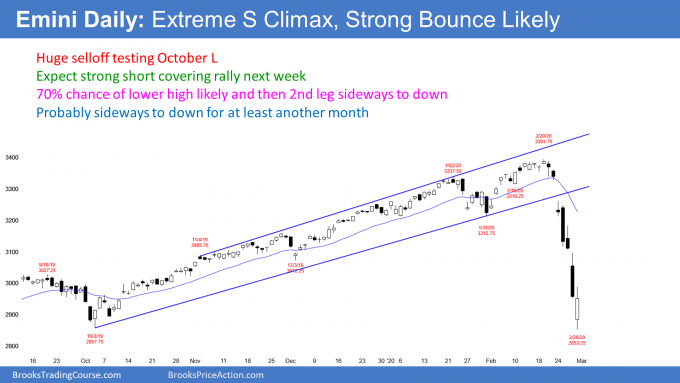
The E-mini is back in the March to October 2019 trading range. For six months last year, traders thought that area was a fair price. They still probably think that it is a fair price. Therefore, the E-mini might get stuck between 2800 and 3000 for a month or longer.
When there is a sell climax down to support, the stop for the bears is far above. They have to reduce their risk. The easiest way is to cover (buy back) some of their shorts.
The bears who missed the first leg down will sell. Also, the bears who were short, but took profits will sell as well. Finally, many bulls who did not exit are eager to exit on the first bounce, hoping to avoid a bigger loss.
Will this be a repeat of December 2018?
The bulls are hoping that price action will replicate the January 2019 climactic reversal. Markets only rarely go from a strong bear trend to a strong bull trend without forming at least a small trading range and some kind of double bottom. Even if the bulls get several bull days, the first leg up will probably be minor. Traders believe that the best the bulls will get over the next few weeks is a trading range.
The selloff was surprisingly strong. It is a Bear Surprise Breakout. Traders should expect at least a small second leg sideways down after the first short covering rally.
What we don’t know is what the market will do once it has that second leg down. If the selloff is just a sharp pullback in a bull trend, the selloff will find support around the low of the current leg. The bulls will try to get a reversal up from a double bottom with the bottom of this current leg down.
Possible Small Pullback Bear Trend
The bears correctly see this week as exceptional. They would like the breakout will be a spike in a Spike and Channel Bear Trend or the start of a Small Pullback Bear Trend. This spike down would be the first leg down. The bears then would expect at least two more legs down. The bulls will then hope for a wedge reversal.
But what if the selloff does not have two or three strong bear legs? It would not be climactic. Instead, it could become a Small Pullback Bear Trend. That can last a long time and fall much further than what traders think is possible. That is what happened in 1929. The market keeps trying to reverse up, but each reversal becomes a small pullback in a bear trend that just keeps selling off.
No, this is not going to be a repeat of 1929. That is just an extreme example of the pattern. But there is a 30% chance that this selloff can fall about 30% to 50% from the high before it ends. It might not end until a worldwide Coronavirus vaccine is about ready to become available.
E-mini has 50% chance of bear market
Again, traders should expect a very strong short covering rally within the next week. It could last two to three weeks, but it should then stall or reverse. Then, there will another leg sideways down to test the bottom of the current first leg down. At that point, we will find out if the selloff will end or continue down much further.
There are far more important technical forces behind this selloff. This is true in terms of the duration and size of the developing move. They will likely affect the market for many months and possibly all year.
When there is a Bear Major Surprise like this, there is a 70% chance of at least a small second leg sideways down and a 60% chance of some kind of measured move down. Traders should expect the market to be sideways to down for at least a month. There is better than a 50% chance that it will continue for several months and reach at least 20%. That is the definition of a bear market. Remember, there is a 30% chance of a 30% to 50% selloff this year.
What to expect next week
I want to be very clear about one point. It is naive and convenient to say that the Coronavirus is the sole or even major reason for this selloff. If it was just the Coronavirus, the market would have fallen 5% and the selloff would quickly end because the Coronavirus story will be minor within a couple months.
There are more important technical forces at work here. Remember, in December, long before the Coronavirus was in the news, I said that the monthly chart should reverse down within five months because of a failed breakout above the monthly bull channel. This and the other technical factors that I mentioned above could affect the market for many months and possibly the rest of the year.
The fundamental factor of the Coronavirus pandemic is difficult to assess with current information. Since the only solution is a vaccine and that is many months away, the fundamental problem might get much worse than what medical and financial experts are now saying.
An initial short covering rally often lasts only a couple days. Traders should expect at least a couple big bull trend days next week. This is true even if March briefly trades below the February low early in the week. But because this selloff was extreme, the rally could be big and last two to three weeks. It will probably make traders wonder if the repeat of the January 2019 rally. But it will not be. We’re going down.
Trading Room
Traders can see the end of the day bar-by-bar price action report by signing up for free at BrooksPriceAction.com. I talk about the detailed E-mini price action real-time throughout the day in the BrooksPriceAction.com trading room. We offer a two-day free trial.


