
With equities under pressure due to Coronavirus fallout, biotech stocks seeking an answer the virus have bullish chart patterns, writes Suri Duddella.
As the Coronavirus outbreak sent markets tumbling, some Coronavirus related biotech stocks are seeing a surge as they race to find a vaccine or a solution. A few biotechnology sector stocks have posted massive returns year-to-date in the last few weeks as they form ABC Bullish patterns.
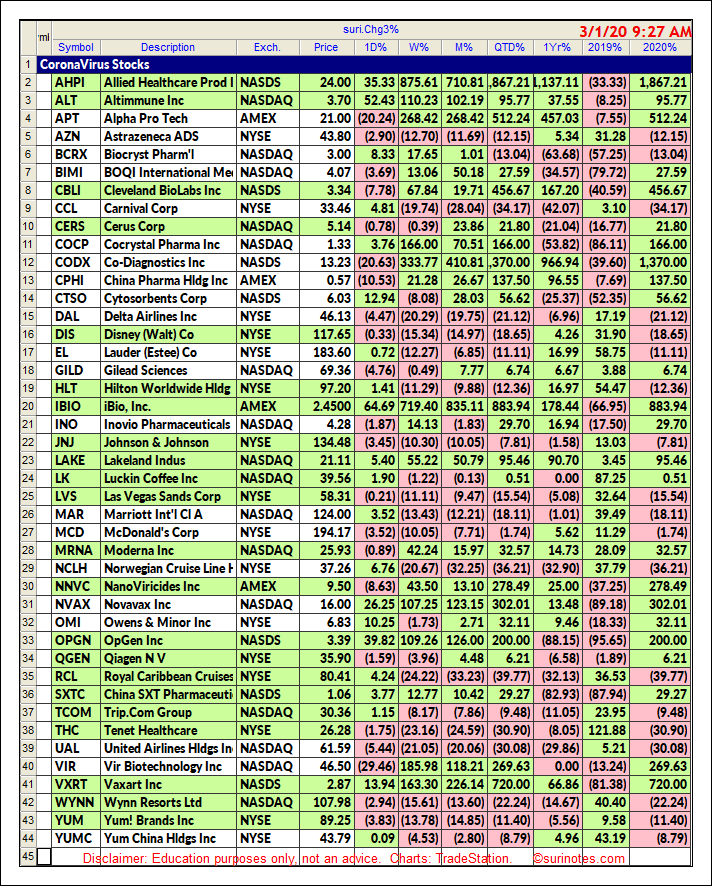
Below is a list of biotech stocks that could profit from research and development designed to address the Coronavirus.
Trading ABC Patterns
The ABC Chart pattern and its related AB=CD Chart Pattern are prime examples of "Symmetry" in the markets. These "Harmonic" patterns help traders to identify buying and selling opportunities in all markets and in all time-frames. The ABC and AB=CD patterns were first described by H.M. Gartley in his book "Profits in the Stock Market," (1935).
The main advantages of trading harmonic patterns are that they allow traders to determine risk vs. reward ratios beforehand as they forecast key market turning points and profit targets for traders. The ABC pattern (can be a continuous or reversal pattern) and it is shaped like a lightning bolt.
Identification
The following chart shows an ABC Bullish pattern formation and its trade information in TradeStation software.
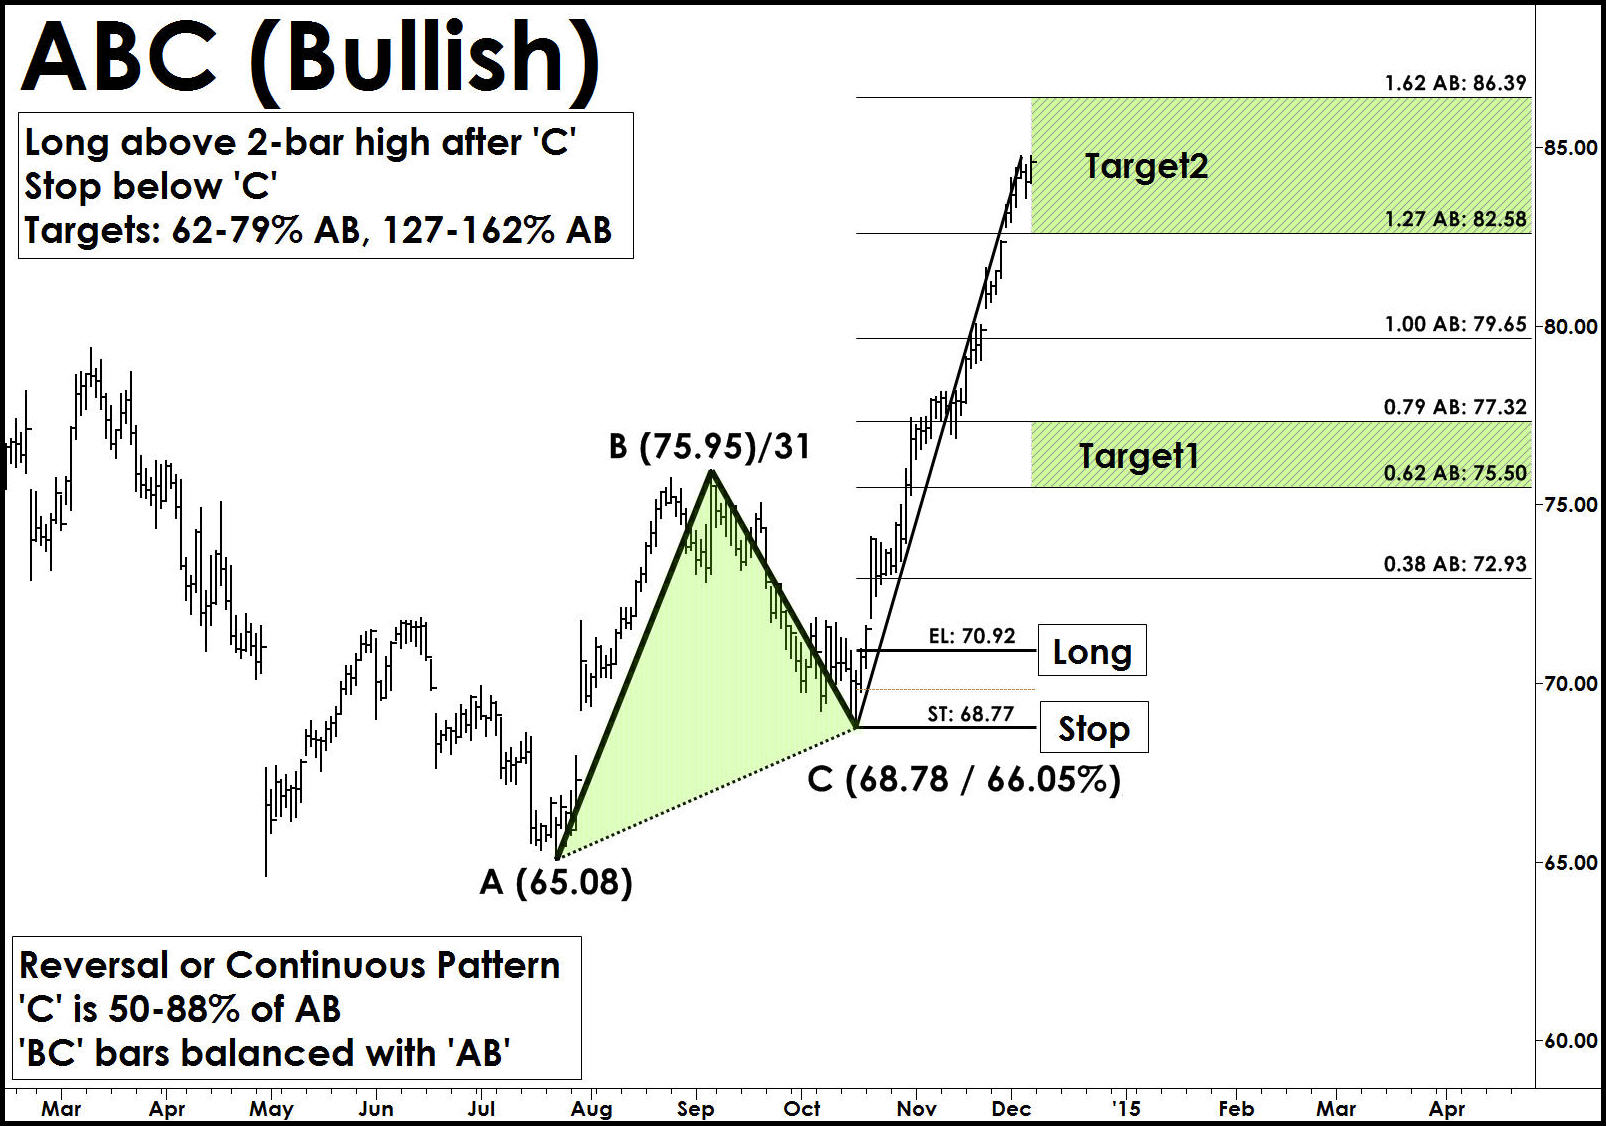
Trade Entry: After ABC pattern is completed, it is advisable to wait for the pattern to confirm a reversal signal using any momentum based indicator or price confirmation mechanisms. Enter after a long trade above the Entry Level ('EL').
Stop: A Stop is placed few ticks below C (in Bullish) or few ticks above C (in Bearish) levels.
Targets: The ABC Pattern targets are computed using the AB and BC swings. The height pattern (AB) is used to project target levels from C-level using Fibonacci ratios. The first target zone is (62% to 79% AB) from 'C' and second target zone is (127% to 162% AB). A secondary target level is set at 100% AB Level.
BioCryst Pharmaceutical Bullish Pattern
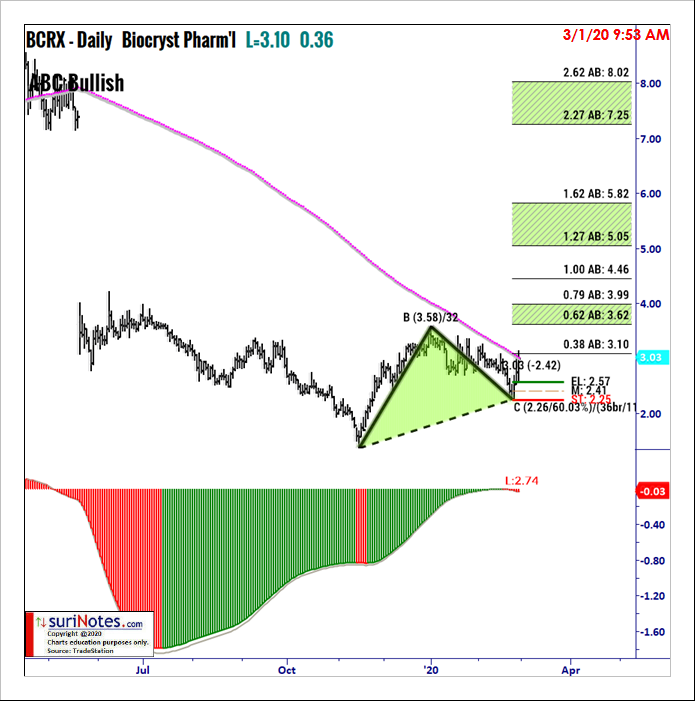
BioCryst Pharmaceutical (BCRX) is forming an ABC Bullish pattern from a low of $1.38 to $3.58 on its daily chart (see below). BCRX retraced 60% to form 'BC' leg and ABC Bullish pattern. Enter a long trade above $2.57 (EL) with targets set at $3.62 to $3.99 and $5.05 to $5.82.
NanoViriCides Inc. ABC Bullish Pattern
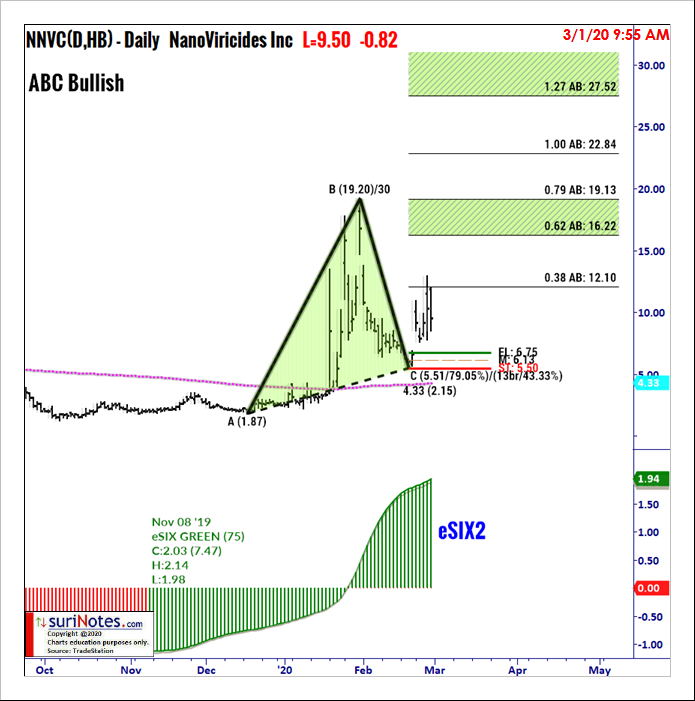
The NanoViriCides Inc. (NNVC) daily chart is indicating an ABC Bullish Pattern (see below). A Long trade is entered above the entry level (EL) at $6.75 with targets placed at $12, $16, $19 and $23, with a stop below $5.50.
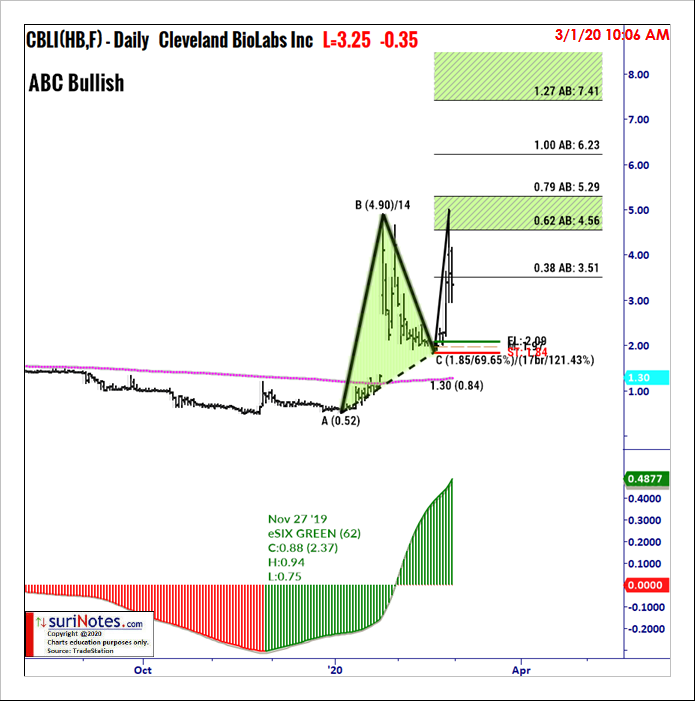
Cleveland BioLabs Inc.’s ABC Bullish Pattern
The daily chart in Cleveland BioLabs Inc. (CBLI) shows an ABC Bullish Pattern. A long trade was entered when ABC is formed following a 69.65% retracement to the C level and price closed above $2.08 with targets at $4.56 to $5.29 and $7.41 to $8.95 with stops placed below $1.85.
Find more of Suri’s work at surinotes.com.


