
While stating that the U.S. public wouldn’t stand for negative rates, they could move close to zero, notes Al Brooks.
U.S. 30-year Treasury bond futures have been rallying strongly with equity weakness, even while the equities reversed briefly. While this is a buy climax, there is no top. Traders will buy the first reversal down.
The 30-year T-bond future has rallied to a new all-time high over the past three weeks on the weekly chart (below). A strong breakout makes at least slightly higher prices likely.
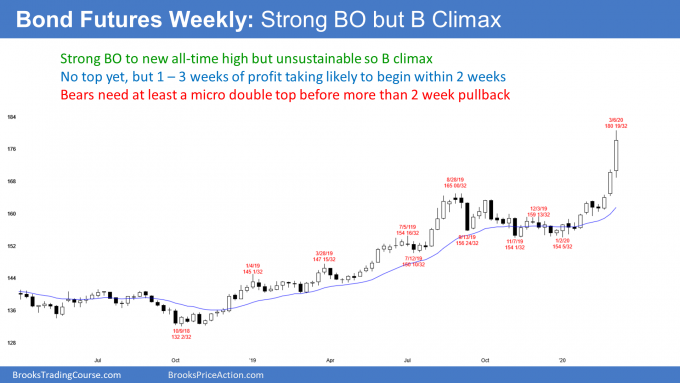
However, the rally on the weekly chart is unusually extreme. Yes, traders will buy the first pullback. And yes, at least a small second leg up is likely. But the stop for the bulls is now far below. Traders therefore have unusually big risk. The easiest way to reduce the risk to acceptable levels is to take some profits. Traders therefore should expect some profit taking to begin within the next couple of weeks.
Minor profit taking soon
The bulls will buy the first pullback. It will therefore likely only last one to three bars (weeks on the weekly chart). But the bulls will probably then take profits again after the one- to three-bar (week) rally that will likely follow the pullback. If that second rally reverses, there would be a type of higher high double top. It would also be a consecutive buy climax, which typically attracts profit takers. When the two highs of a double top are only a few bars apart, it is a micro double top.
Once the bulls take profits a second time after an extreme rally, they will not be eager to buy again a few bars later. If that was there plan, it would not make sense to take profits.
When they take profits, they wait to see how strong the profit taking will be and how aggressive the bears will be. Traders typically like to give the bears at least two chances to begin a swing down. If the bears try twice to reverse the trend but fail, the bulls will buy again, and the trend up will resume.
When I say that the bulls will give the bears two chances, I mean most bulls will not buy until after at least a couple legs sideways to down. That process often takes about 10 bars. Sometimes more, sometimes a little less.
Traders should expect a brief pullback within a couple weeks on the weekly chart. It will probably last one to two weeks. There will then typically be a one to three-bar rally to a new high. At that point, profit taking will probably result in a five to 10-week, sideways to down move.
What about the nested wedge top on the monthly chart?
The monthly chart formed a nested wedge top from 2008 to 2016 (see below). That typically results is at least two sideways to down legs. Also, the pullback usually has about half as many bars as there were in the rally.
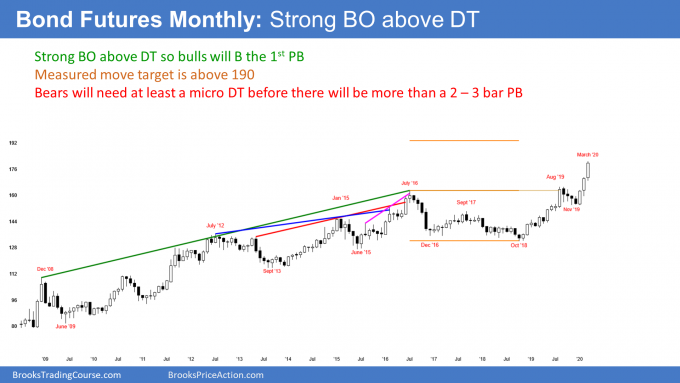
The selloff from the 2016 high had two legs and lasted three years. It met the minimum objective of the bears. However, the nested wedge top made a deeper and longer correction likely. The odds favored a trend reversal lasting a decade or more. This breakout is therefore a low probability event, a Surprise Breakout.
When there is Surprise Breakout above a reasonable top like this, traders expect at least a couple legs up. Consequently, they will look to buy the first one- to two-month pullback on the monthly chart.
Furthermore, when there is a strong breakout above a credible top, traders also look for a measured move up based on the height of the top. A measured move up from the 2018 low to the 2016 high is above 190. While that might seem unreachable, it is a logical target for this rally over the next couple years.
What about negative interest rates?
I have said that I do not believe that Americans will allow negative interest rates. While this huge rally increases the chance, I still do not think it will happen. But, the 10-year and 30-year U.S. interest rates could fall very close to zero or even to zero.
Trading Room
Traders can see the end of the day bar-by-bar price action report by signing up for free at BrooksPriceAction.com. I talk about the detailed E-mini price action real-time throughout the day in the BrooksPriceAction.com trading room. We offer a two-day free trial.


