
Treasury bonds set all-time highs and reversed last week. Is this a major top, asks Al Brooks.
U.S. 30-year Treasury bond futures has had the most extreme buy climax in its history. Last week’s reversal will probably be the start of a few weeks of sideways to down trading.
The long bond had a huge rally over the past three months on the weekly chart (see below). It was especially dramatic over the past four weeks.
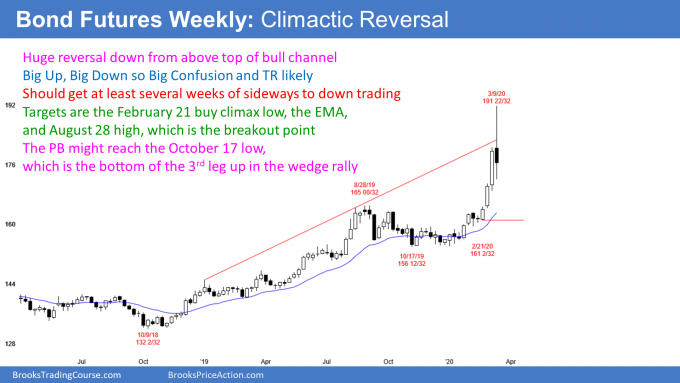
Bond futures reversed down strongly from above the top of its bull channel. The selloff should test the Feb. 21 low within a few weeks. It might reach the Oct. 17 low within a couple months.
When a buy climax reverses down, the bottom of the most recent buy climax and of the most recent leg up are magnets. The selloff typically has at least a couple legs sideways to down. It should then evolve into a trading range for several weeks.
When the biggest breakout in a bull trend comes late in a bull trend, there is a 60% chance that the bull trend will pause at that point or after one more brief push. Additionally, there is a 60% chance that there will be one more push up. However, this week’s reversal was so extreme that, if there is one more push up, it will probably make a lower high.
A buy climax leads to a pause in the bull trend and not necessarily to a trend reversal. It is important to note that I did not say that the climactic reversal down would lead to a bear trend. There is a 40% chance that it will after several months. But there is a 60% chance of the bond market going sideways for a month or more. A trading range is more likely than a bear trend or an immediate resumption of the bull trend.
After there are a couple legs sideways to down, the bulls will consider buying again. They will need to see signs that the bears are unable to continue the reversal down into a bear trend.
If the trading range lasts 10 or more bars, the bears would then have a better chance of reversing the bull trend into a bear trend. They typically need to stop the bull trend for many bars before traders will be willing to short and hold shorts for a swing down.
Targets for the bears
If the bears get a swing down, an important target is the bottom of the most recent buy climax. That is the low of four weeks ago. The 20-week exponential moving average and the August high are magnets as well.
The three weeks before this week’s reversal were in a breakout. They broke above the old high, which is the August high. It is therefore the breakout point. After a breakout, there typically is an eventual pullback to the breakout point. Traders want to see if the bulls will again buy at that price. If enough do, the bull trend will resume.
After Big Up, Big Down, there is Big Confusion
This week’s selloff was big, while not as big as the three-week rally. However, it was big enough to generate confusion. Traders are wondering how long the sideways to down trading will last and how far it will go. They typically need many weeks before they can draw a conclusion.
In the meantime, they are uncertain. When traders are uncertain, they are unwilling to hold onto positions very long. Additionally, they prefer to buy low and sell high. The result is a trading range, and that is what traders should expect over the next month.
When the market is in a trading range, there are usually more traders looking to buy below bars and sell above bars. They bet on reversals instead of trends. Consequently, even though this week is a sell signal bar, the reversal down will probably be minor. That means traders expect that the first leg down will lead to a trading range and not a bear trend.
Trading Room
Traders can see the end of the day bar-by-bar price action report by signing up for free at BrooksPriceAction.com. I talk about the detailed E-mini price action real-time throughout the day in the BrooksPriceAction.com trading room. We offer a two-day free trial.


