
The Coronavirus has helped pushed equities into a bear market but one subsector, Remote Work Access Stocks, should get a boost, reports Suri Duddella, who shares some bullish chart patterns.
As the demand for a number of people working from home increases during the Coronavirus crisis, remote work apps usage increased across the world.
The technology behind the remote work apps is in cloud computing, remote access, teleconferencing, internet network services, security, and mobile networks.
Here is a list of few companies, which facilitate the remote work apps.
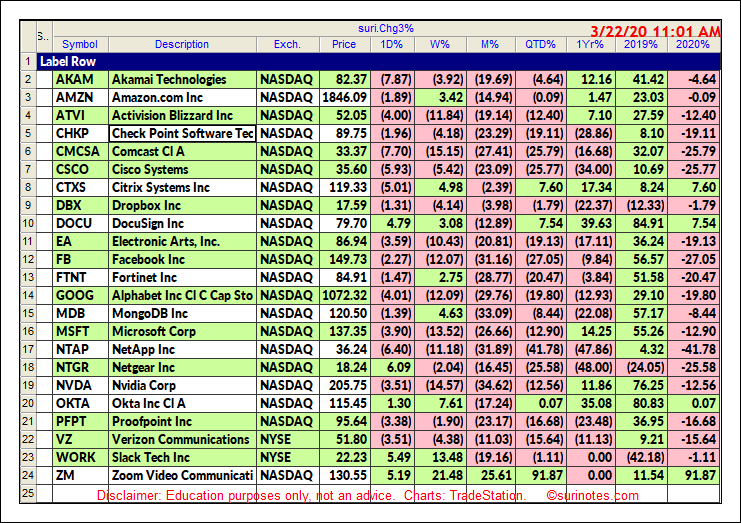
Trading ABC Patterns
The ABC Chart pattern and its related AB=CD Chart Pattern are prime examples of "Symmetry" in the markets. These harmonic patterns help traders to identify buying and selling opportunities in all markets and in all time-frames.
The ABC and AB=CD patterns are first described by H.M. Gartley in his book "Profits in the Stock Market." The main advantages of trading harmonic patterns are that they allow traders to determine risk vs. reward ratios beforehand as they forecast key market turning points and profit targets for traders. The ABC pattern (can be a continuous or reversal pattern) and it is shaped like a lightning bolt (see below).
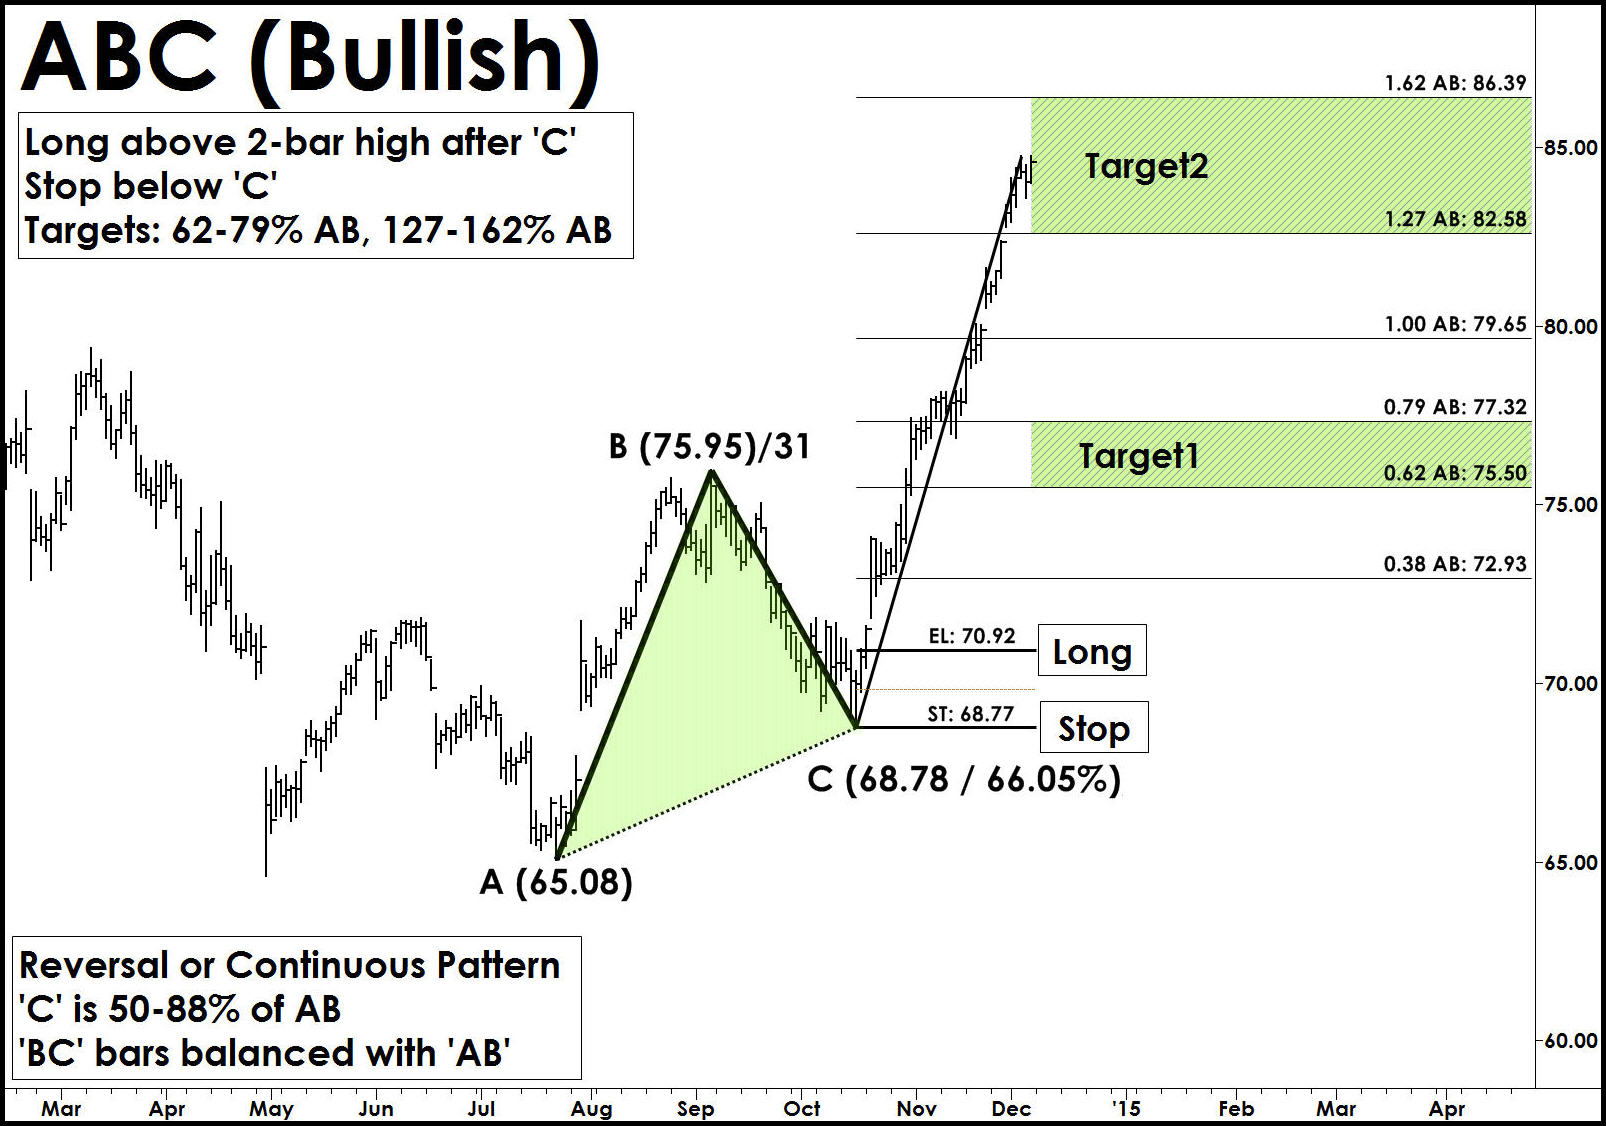
Trade Entry: After ABC pattern is completed, it is advisable to wait for the pattern to confirm a reversal signal using any momentum based indicator or price confirmation mechanisms. Enter after a long trade above the Entry Level ('EL').
Stop: A Stop is placed few ticks below C (in Bullish) or few ticks above C (in Bearish) levels.
Targets: The ABC Pattern targets are computed using the AB and BC swings. The height pattern (AB) is used to project target levels from C-level using Fibonacci ratios. The first target zone is (62% to 79% AB) from 'C' and second target zone is (127% to162% AB). A secondary target level is set at 100% AB Level.
ABC Bullish Pattern Examples
Please note all the following patterns are still forming and require the underlying trend to reverse its current trend to bullish to confirm the bullish patterns.
NVDA ABC Bullish
The following chart shows the Nvidia (NVDA) daily chart with ABC Bullish pattern and underlying trend. NVDA traded from a low of $147.39 (August 2019) to a high of $316. (February 2020) and formed an ABC Bullish pattern. The underlying trend is still not confirmed to have reversed the bullish pattern needed for a trade entry. With the given current setup, the entry-level is $211.50 and stops below $180. Targets are $244, $285-$313.

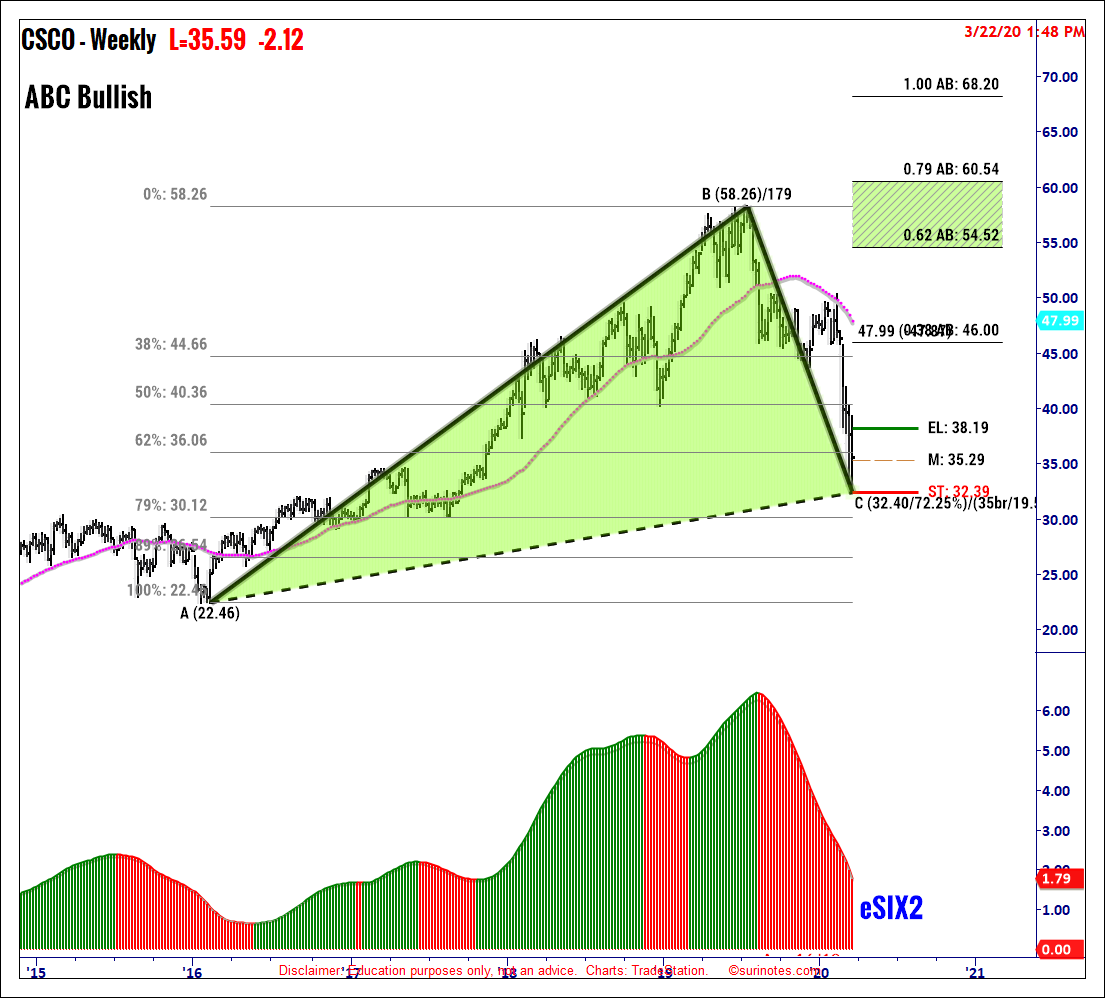
CSCO ABC Bullish Pattern
Similar to the NVDA stock, Costco Wholesale Corp. (CSCO) also formed an ABC Bullish pattern on its weekly chart. It went from a low of $22.46 in January 2016 to a high of $58.26 in January 2019. Since January 2019, CSCO retraced 72% to form an ABC Bullish pattern. If price confirms a trend reversal, CSCO's current entry is above $38.19 with targets $46 and $54-60, and a stop loss is below 'C' pivot ($32.40).
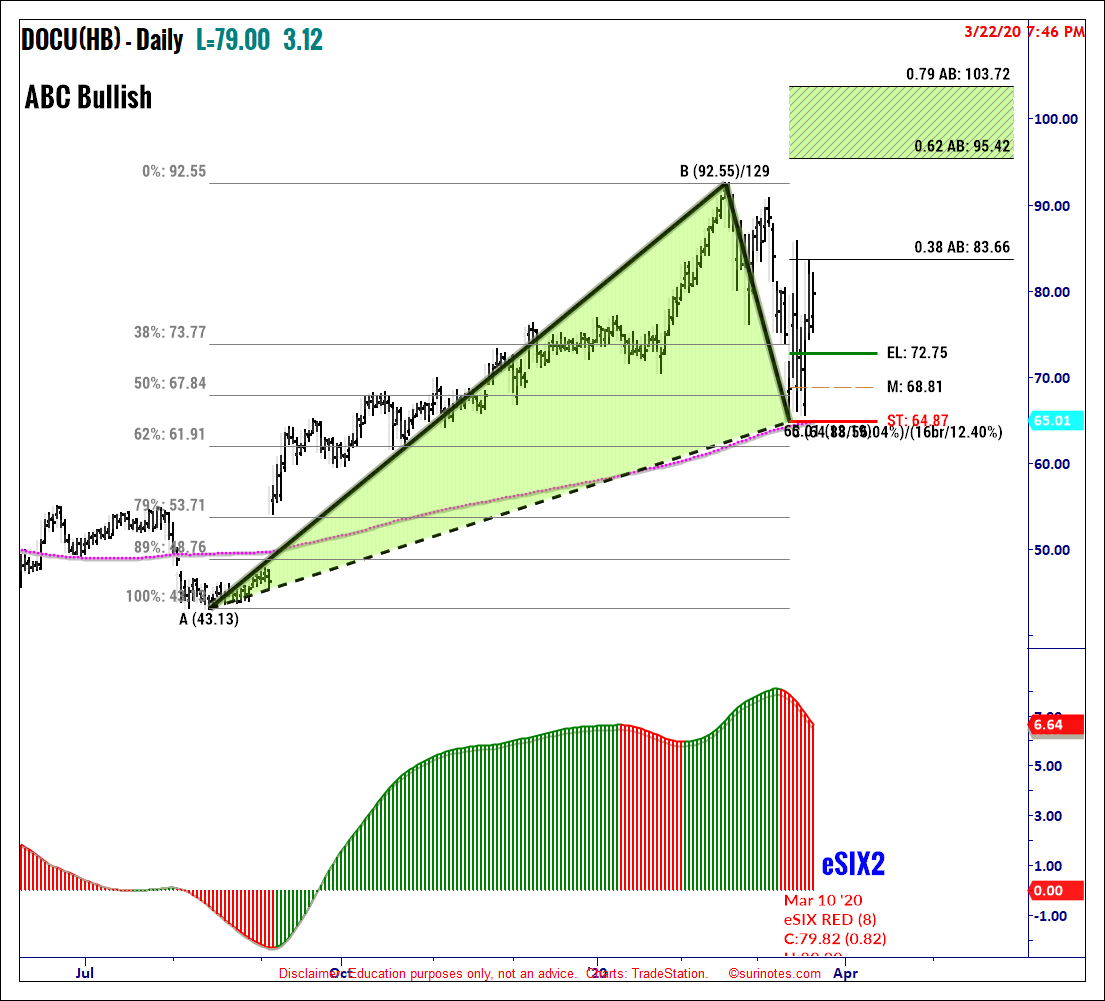
DocuSign ABC Bullish Pattern
The following chart shows the DocuSign (DOCU) daily chart with ABC Bullish pattern. DOCU formed an ABC Bullish pattern from a low of $43.13 to a high of $92.55 and retraced 56% to $64.88. The underlying trend is still bearish as the price started to trade above the entry-level ($72.75). If prices continue to trade higher and confirm the reversal, the targets are set $95 to $103 with a stop below $64.
Find more of Suri’s work at surinotes.com.


