
“This year will be great for traders and terrible for investors,” writes Al Brooks, but the short-term battle is whether March closes above or below the December 2018 low.
The E-mini S&P 500 reversed up from an extreme parabolic wedge sell climax last week. The first leg up of the short covering rally could last several weeks. In a few months, it might reach 2,800 to 3,000. Traders should expect a trading range for a couple months and probably all year.
The E-mini S&P futures formed the biggest bar in the history of the stock market in March on the monthly chart (see below). It broke below the December 2018 low, which was the bottom of the two-year trading range.
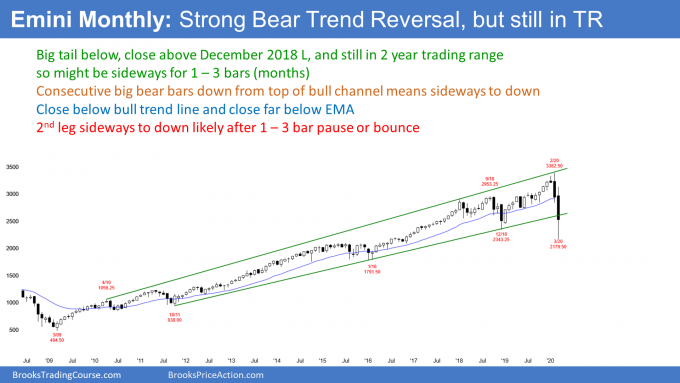
However, it bounced strongly this past week. The bulls are trying to minimize the damage when the month ends on Tuesday. Their first goal is to have March close above that December 2018 low. The E-mini therefore would still be in its two-year trading range.
A more important goal is to have the E-mini close back above the bottom of the 11-year bull trend line. That line is around 2610.
There is a small chance that the March might even close above 2706. That is 20% down from the Feb. 19 all-time high. If the bulls can get the E-mini back above that line, it would no longer be in a bear trend.
Has the bear trend ended?
No. The past two months were surprisingly big bear bars. When there is a bear surprise, there typically will be at least a small second leg down. A surprise means that traders were not expecting it. That means there are many bulls who failed to exit. They are hoping for a rally that will allow them to sell with a smaller loss. That means there is supply above.
Also, there are bears unwilling to sell too low, but eager to sell a bounce. They, too, want a rally to sell.
With both bulls and bears hoping to sell a rally, there should be at least a small second leg sideways to down. However, the sell climax was extreme. Therefore, the rally could be surprisingly big as well.
For example, it might even reach the March 3 high on the daily chart. That was the first rebound after the initial collapse. It was therefore the start of the parabolic wedge bear channel. That is always a magnet for a rally in a bear trend.
More likely, the rally will stall around the 3,000 Big Round Number, which is around significant resistance levels from 2018 and 2019.
Can the E-mini continue to crash in April?
After two big bear bars, there is an increased chance of a third bear bar, but there are several factors that reduce the chance of a third huge bear bar. The obvious one is that the E-mini is at the bottom of its two-year trading range. Trading ranges resist breaking out.
Also, the average bear market falls about 30%. The selloff in the E-mini was almost 35%. It is already more than average. In most bear markets, it takes about a year to get there. Since the E-mini got there so quickly, traders think that it is overdone near-term.
President Trump took office on Jan. 20, 2017. The E-mini tested below the open of that day several times this week. The selloff therefore briefly erased all of the gains of his presidency. However, it reversed up violently. Traders now see that price as strong support.
The Fed will protect the economy
The most important reason why April will probably not crash is that the Federal Reserve is determined to prevent more damage to the economy. Neel Kaskari is the president of the Federal Reserve Bank of Minneapolis and he was on 60 Minutes last week. He made it clear that the Fed would print (infinite) dollars to save the economy.
That is giving institutions the confidence that they need to buy again. In addition, Congress’s rescue plan is important. The government’s actions should be enough to prevent much lower prices in April. Since the E-mini is holding important support, it will probably be sideways to up for at least a month.
But this damage is ongoing and will take a long time to heal. Furthermore, there are underlying problems with the economy. How do I know The huge buy climax in 2017 was the most extreme in history? The bulls will need years to recover. This will probably result in a trading range for a decade. Any rally will probably only be a bull leg in that 10-year trading range.
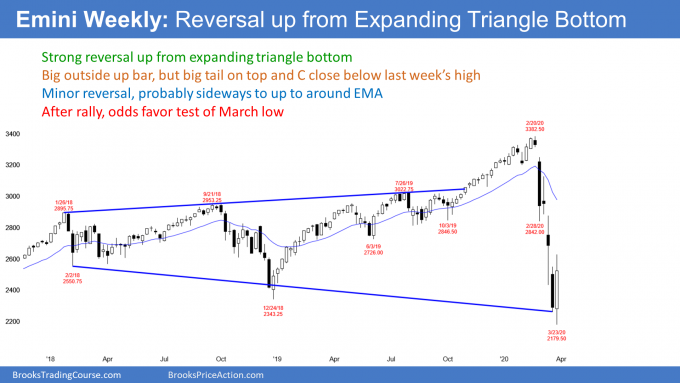
The E-mini futures chart traded below the previous week’s low and then above its high on the weekly chart (see below). Last week is therefore an outside up candlestick. The bulls see it as a failed breakout below the December 2018 bottom of the two-year trading range.
Expanding triangle bottom
This week is now a buy signal bar for an expanding triangle bottom. The first two lows are the February and December 2018 lows. An expanding triangle bottom often leads to a bull trend and a break above the top of the triangle. That is the February all-time high.
However, this reversal up is coming after an exceptionally strong selloff. It is more likely that the first rally will have a hard time getting much above the middle of the triangle. That is around 2800 to 3000. Many traders who bought last week will take profits there. The traders (let’s not call them bulls) who bought higher will sell since they recovered half of their losses. The bears will begin to look to sell there, expecting a test of the March low. Therefore, the reversal will probably be minor. Traders should understand that it is more likely to lead to a trading range or a bear flag than to a bull trend.
The E-mini futures reversed up strongly last week on its daily chart (see below). It broke above the month-long bear trend line. The E-mini is no longer in a Small Pullback Bear Trend. However, it is still in a bear trend— and it is now additionally in a bull trend! And that means it is also in a trading range!
How can that be? If this rally turns down and there is a new low, traders will say that the rally was just a pullback in the bear trend. If the E-mini continues up to a new high, they will say that the bull trend began this week.
Since both are reasonable possibilities, the E-mini is currently both in a bear trend and in a bull trend. That is confusing, and it also means that it is in a trading range.
Confusion means traders want more information
When there is a trading range, traders want more information before deciding on the direction over the next few months. They usually need a lot of bars before they will have a strong opinion.
A lot of bars could mean several months. If that is true, there will be legs up and down. Furthermore, there will be both buy and sell setups in the range. For example, most trading ranges have both a double top and a double bottom.
For traders starting out, this is an annoying concept. How can the market be in both a bull and a bear trend at the same time? However, experienced traders know that this is common after a big move. Sometimes, the direction is simply not clear. This is one of those times.
Bear markets usually last about a year
Traders are wondering if this reversal up will be like the January 2019 V bottom. Bear trends end with V bottoms only about 20% of the time. Therefore, even if there is a strong rally for a few months, it will probably not continue up to the old high.
If the rally is in a Small Pullback Bull Trend in April and May, more and more people will claim that it is a repeat of the January 2019 bottom. But there is an 80% chance that they will be wrong.
When a selloff is as strong as this one has been, the first reversal up is typically minor. This is true even if it goes straight up for a couple months.
A minor rally means that traders should expect the rally to reverse down and test the bear low. At the moment, that is the March low. If there is a second reversal up from around that low, the probability of a reversal up into a bull trend would be greater. Traders would look at that buy signal as a major trend reversal.
The end of a bear market does not mean the start of a bull market. The E-mini will probably be sideways for a decade. That means no bull or bear market. But there will be trends up and down within that range, and some will last one to three years.
How high will the E-mini go?
It is important to remember that a good major trend reversal setup has only a 40% chance of actually leading to a new trend. Therefore, a trading range is likely for the next several months. It could last all year. The E-mini will probably not get back to the old high for at least a year or two. Even if it does, it will probably just be testing the top of what will be a 10-year trading range.
Legs in trading ranges often go well past the midpoint. At a minimum, this rally will probably get above 2615.40. That is a 20% rally from the low. The bulls could argue that the E-mini is back to being in a bull trend.
A similar target is 2715.00. That is the 20% correction level. If the E-mini gets above it, its bear market will have ended, at least temporarily.
Another important target is the top of the two-year trading range, which is just above 3000.
Next, the rally after a sell climax frequently retraces up to the top of the most recent leg down. That is the March 3 high of 3125.75. That is so far above that the E-mini can probably not get there without a test of the March low first.
Most likely, the E-mini will have a difficult time getting above 2800 to 3000 for the rest of the year.
Can the bear trend continue down to 50% or more?
It is too early to tell. As I said, the final low in a bear market comes on average about a year after the bear trend begins. Traders therefore will wonder if every rally will fail in 2020.
The bears hope that the two-month selloff is a spike in a Spike and Channel Bear Trend. They would like at least two more legs down. If they get that, the final low will be 50% to 60% below the February high.
The 1929 Crash was a Spike and Channel Bear Trend. There were many legs down and the market lost almost 90%. That will not happen this time. The best the bears will probably get is a 40% to 50% correction. That will only happen if the worst case scenario happens with the Coronavirus.
The main reason for the massive drop in 1929 is that the government did not know what it was doing. Today's government does. Well managed economies over the past 20 years have contained losses to about 60%. I think the worst case today will be about 60%. However, our government can only minimize the damage. It cannot fix the economy. The damage is ongoing, and it will take years to repair.
If the bottom is near, is the bull trend resuming?
It is a common mistake to assume that the end of a bear trend means the start of a bull trend. Much more often, the bear trend evolves into a trading range.
Once the market is clearly in a trading range, there is then a 50% chance of a resumption of the bear trend and a 50% chance of a reversal into a bull trend. This transition will take many months.
onsequently, traders should assume that the two-year trading range will continue into the summer. There might be one more brief new low, but a big new low is unlikely near-term.
Furthermore, the two-year range will likely evolve into a taller range over the next decade. The range will probably be between around 1800 and 3600.
Too many bulls
There is too much bullishness out there. Everyone is talking about the bottom being in and how this is such a great buying opportunity. They keep comparing it to the December 2018 selloff and all of the other selloffs over the past decade.
The difference is that all of those were in a 12-year bull trend. This selloff is the start of a bear trend. This bear trend will be the first bear leg in a decade long trading range. That range will have at least a couple one to three-year bull and bear trends.
It is important to not forget that the E-mini fell 34% in five weeks. Please understand that this represents tremendous damage. It does not get fixed with even massive government action.
While the bulls might be able to halt the bears for a while, the bears are still in control. I doubt that this is a bull market. As I have been saying, the market will have a difficult time getting much above the February high for the next decade. Also, the bear market low will probably be between 1800 and 2000.
No one knows if that low will come soon or more than a year from now, but it is difficult for me to believe that the Fed and Congress have fixed the economy this quickly.
20% down and now 20% up
When the E-mini fell to 2706, it was 20% down from the high. That meant it was in a bear market.
On Thursday, it rallied above 2614. That is 20% above the bear trend low. The bulls therefore believe that the E-mini is now in a bull market. They would like it to totally erase any claims by the bears and therefore want it to get back above 2706.
Call it what you want. To me, this is a strong rally after an extremely strong sell climax. There is only a 30% chance that it will continue up to the February high without a test of the March low.
Furthermore, there is currently a 60% chance that the March low will not be the final low. Also, there is a 50% chance that the final low will be at least 40% down from the high.
The final low typically comes about a year after the bear market begins. However, those odds will get smaller if this rally goes much further up.
What to expect next week
The end of the quarter it usually bullish. This is especially true after the most dramatic sell climax in history. The rally is strong enough so that it will probably have at least a small second leg up. But it is still a bear rally and the odds favor at least a test of the March low. Most likely, the final low will be at least 40% down.
When will the bears get their test down? No rush. Big Down, Big Up creates Big confusion, and confusion creates trading ranges. Traders are not sure of the direction and are therefore quick to take profits. They bet on reversals instead of successful breakouts.
Another hallmark of a trading range is disappointment. Most strong moves up and down will have bad follow-through because traders are unwilling to hold onto positions. They expect reversals.
The E-mini will probably be in a trading range for several months and possibly all year. That means that it will rally for a week or two and sell off for a week or two. This will probably happen at least a few times.
There is probably at least another day or two left to this initial rally. Traders will probably buy the first one- to two-day pullback. But then many bulls will take profits on the next brief rally and the bears will begin to sell again. This year will be great for traders and terrible for investors.
Trading Room
Traders can see the end of the day bar-by-bar price action report by signing up for free at BrooksPriceAction.com. I talk about the detailed E-mini price action real-time throughout the day in the BrooksPriceAction.com trading room. We offer a two-day free trial.


