
Understanding the dynamics of rising volatility is a key lesson, reports Alan Ellman.
For covered call writers and sellers of cash-secured puts, rising volatility has two faces. It is our friend in that our premiums will be higher as they are directly related to the implied volatility of the underlying securities. It is our enemy as we will be subjected to greater downside risk. So, which is it, our friend or our enemy? This article will make the case for the latter, though one should see it similar to the imbedded leverage in options and futures contracts, a two-edged sword in that it provides both greater opportunity and risk.
The crash of 2008
Many of us recall the market crash in the latter half of 2008 where the market lost nearly 40% of its value. A significant percentage of retail investors took a major financial hit and (unfortunately) never returned to the market. Starting in March 2009, the recovery began at an historic rate and continued through the end of 2019.
The chart below shows the CBOE Volatility Index (VIX) from 2008 – 2019
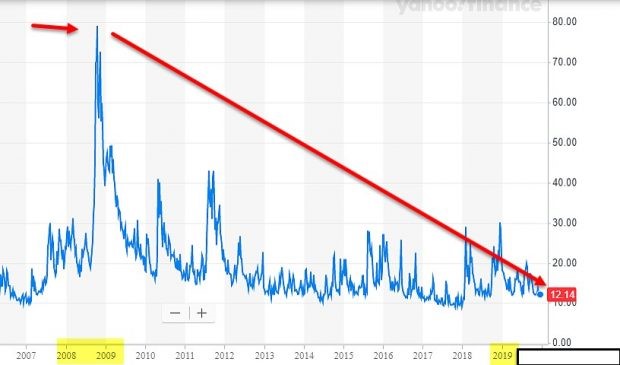
VIX: 10-Year Chart
The chart depicts a huge spike in the VIX in the latter part of 2008 (up to 80) and then a decline (to 12) by the end of 2019.
Below is a chart comparing the VIX and the S&P 500 from 2008 through 2019
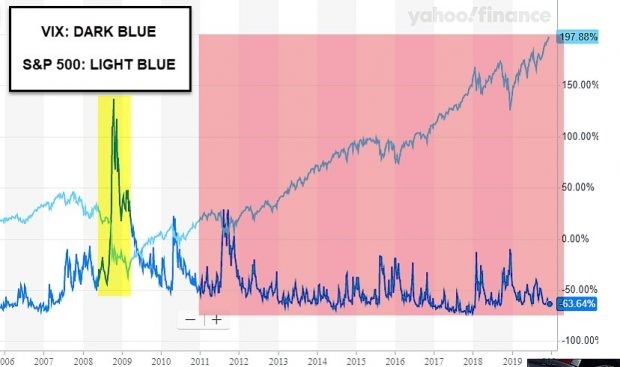
VIX and S&P 500: Post-Crash Comparison Chart
The yellow field shows a substantial spike in the VIX corresponding to the market crash of 2008. The pink field shows an historic decline in the VIX, which corresponds with the dramatic 12-year bull equity market with very few significant corrections.
Covered call writing and put-selling are conservative strategies for conservative investors. We look to generate small but consistent returns (singles and doubles but never grand slam home runs). When volatility runs high, we favor defensive positions with in-the-money calls and deeper out-of-the-money puts. On the other hand, when volatility declines, we take more aggressive positions using out-of-the-money calls and slightly out-of-the-money puts. That said, there are other factors to consider like technicals and personal risk-tolerance so these conclusions should be used as guidelines.
Discussion
A macro view of market volatility from the crash of 2008 and the subsequent decade makes a case that high volatility is a negative for conservative option-selling strategies and should dictate a more defensive approach. That’s where we are now with the Coronavirus crisis. A declining or consolidating VIX at historically low levels will guide us to take more aggressive positions.
Coronavirus-related comparison chart
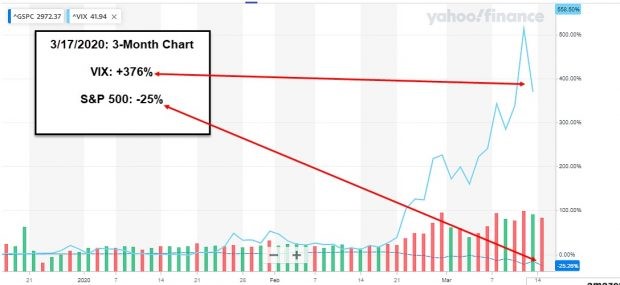
Coronavirus Impact on the VIX-S&P500 Inverse-Relationship
The chart confirms the huge price decline of the market along with the exponential acceleration of the VIX. This market is an aberration where we normally don’t see moves to this extent. Most retail investors should consider moving to cash when volatility is so high and technicals are extremely bearish. The use of Inverse exchange traded funds (ETFs) can be used to mitigate losses or even create positive cash flow.
BCI Market Assessment (March 22)
I am in 50% cash with a dominant presence of Inverse ETFs. All inverse ETF options for the March contracts expired in-the-money due the 15% decline in the market the prior week. My tentative plan (I want to review option-pricing on Monday) for the April contracts is to remain in 50% cash and take equal positions with the better-performing SelectSector SPDRs and SH, the inverse ETF for the S&P 500. This is similar to fund managers moving to Delta-neutral portfolios to minimize market risk. Depending on option prices on Monday, I will favor in-the-money strikes on all securities. The rationale is that by taking both bullish and bearish positions and lowering my cost-basis to the greatest extent with ITM strikes, I will benefit from market movement in both directions. Of course, our upside is capped as with our covered call positions, so our exit strategy arsenal must be ready for action (20%/10% guidelines immediately put in place). I have never used this approach before, so I don’t recommend you do so, but I’ll be happy to report back to you on final contract results. I remain long-term bullish.
Use the multiple tab of the Ellman Calculator to calculate initial option returns (ROO), upside potential (for out-of-the-money strikes) and downside protection (for in-the-money strikes). The breakeven price point is also calculated. For more information on the PCP strategy and put-selling trade management click here and here .


