
Last week we shared a story about an experiment where a group of individuals were tasked with counting the number of basketball passes made in a video. The experiment was called the Invisible Gorilla and it was meant to illustrate how perception framing can cause people to miss important facts.
What it revealed to us was an obvious investment strategy, which we had missed due to perception framing. Upon research we discovered a better strategy that existed right under our noses.
It is Risk Parity where we apply diversification to weight the constituents based on changes in volatility so we are applying equal weights based on risk. Risk Parity means dollar weighting of portfolio constituents as they change inversely based on volatility. A 50/50 Risk Weighted Portfolio, i.e., Risk Parity, allocates “constant risk” (also called “target volatility”) equally to Equities and Treasuries (Fixed income), while also targeting volatility for the whole portfolio.
50/50 Risk Parity: The Best Benchmark for Stocks & Bonds
The size of the U.S. fixed income market was approximately $43 trillion as of 2018. The capitalization of the NYSE and NASDAQ was $30 trillion (U.S. companies only). Globally, the equity and bond markets, respectively, were $75 trillion and $103 trillion as of 2018. U.S. fixed income publicly traded securities include Treasuries, mortgage backed securities (MBS), agencies, corporates and municipals. Closely held shares, preferred stock and U.S. owned equities of foreign companies total another $12 trillion, according to SIFMA.
As of 2018, fixed income was approximately 60% of the public securities outstanding in the United States versus 40% equities. Globally, fixed income was 58% and Equities 42%. This ratio obviously changes over time.
One reason this is interesting, is that a 50/50 Risk Parity portfolio of large cap equities, equivalent to the S&P 500, and the 10-year Treasury has had a dollar weighted average through time of 65% Treasuries and 35% equities. In other words, our admittedly “stylized” Risk Parity portfolio, which is highly liquid and easily implemented, has had average dollar weights comparable to the U.S. Capital Market Weighted Portfolio since at least 1978.
The Risk Parity portfolio comes as close as one can get to the highest ex-post (or actual) Sharpe ratio portfolio that combines stocks and bonds. The reason is straight forward: Modern Portfolio Theory tells us that the expected long-term Sharpe ratio of these two asset classes should be approximately equal, and historical data supports this.
Additionally, from 1945-2018, there were 16 calendar years when the S&P 500 was down (average annual loss of 11.7%). In 15 of those years, the five-year Treasury had positive returns (average annual gain of 6.2%). Additionally, Treasuries and stocks have not been down in the same year since 1969. While the long-term correlations of these two asset classes are slightly above zero, there is much evidence that there is some conditional negative correlation between them.
Efficient Frontier and the Tangency Portfolio
The “Efficient Frontier”, for two asset classes, is simply a graph of returns and volatility that is drawn based on all possible dollar combinations of the two asset classes. In our example, at one extreme is 100% equities and, at the other, 100% 10-year Treasuries. In the middle is every combination in between. Such graphs are typically drawn with Portfolio Volatility on the X-axis and Portfolio Returns on the Y axis. It is called “efficient” because for any specific level of volatility there is only one combination, which can produce the highest rate of return for that volatility.
The Tangency Portfolio is the point on the Efficient Frontier that has the highest Sharpe ratio versus all other combinations of weightings. It is called the “Tangency Portfolio”, because one can draw a straight line (called the Capital Market Line) that is “tangent” to that point on the Efficient Frontier, and all other points on the Efficient Frontier fall below the line. The Capital Market Line represents the returns and volatilities (annualized standard deviations) of different leverage levels of the Tangency Portfolio (see chart below).
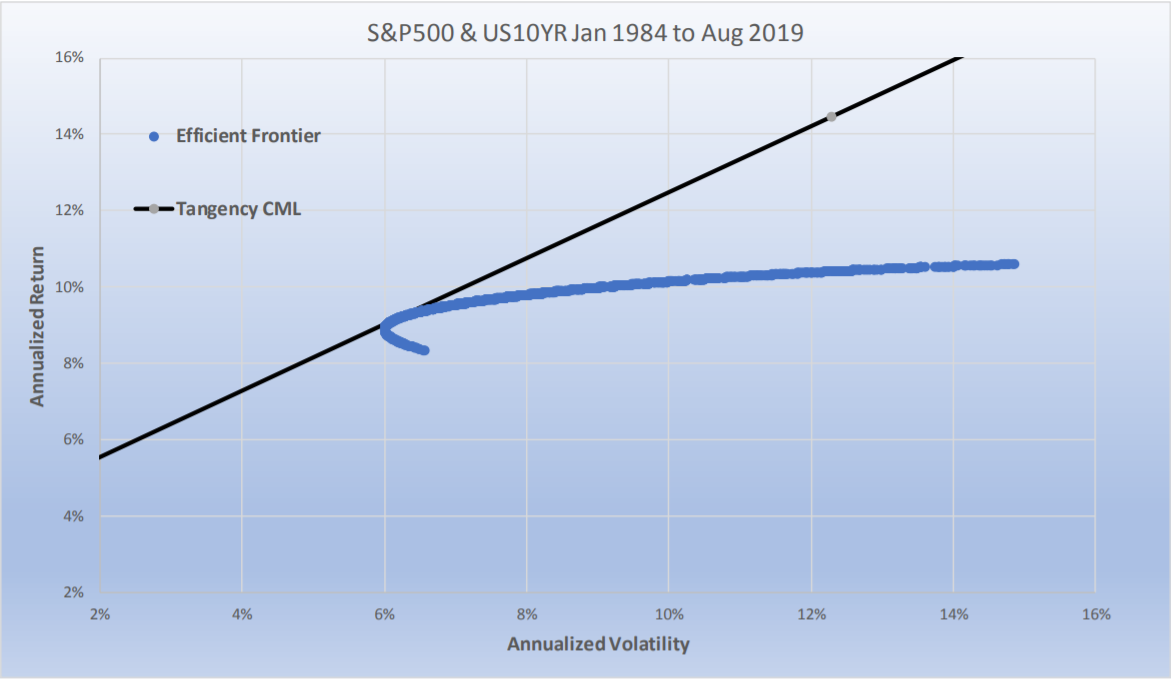
At the Tangency point, the portfolio has no leverage. Above the Tangency point the portfolio is leveraged—or “borrows” to own more of the portfolio. Below the Tangency point, the portfolio replaces part of the Tangency Portfolio with “cash”— or “lends” to own less of the portfolio.
In our next posting we will go into greater detail on how we use the Efficient Frontier and Tangency Portfolio to design a better investment strategy.
Michael S. Rulle, Jr. is the founder and CEO of MSR Indices, LLC, a commodity trading advisor that offers an expansive range of index-tracking investment programs. This piece is an excerpt from a white paper titled: “The Gorilla in the Room: The obvious method of asset allocation most of us have never considered.”
Rulle inspired a family of indexes launched by S&P Dow Jones called S&P Risk Parity Indices, Rulle discussed Risk Parity at the 2019 TradersEXPO New York. Prior to founding MSR in 2015, he was president of Graham Capital Management, where he was directly responsible for the firm's discretionary portfolio managers.


