
The S&P relief rally has gone as far as it can go and will soon reverse, reports Al Brooks.
The E-mini S&P 500 should test support between 2500 – 2600 in May. There is a wedge top on the daily chart. But there are High 1 bull flag buy signals on both the daily and weekly charts. There will probably be one more brief leg up to the 20-week exponential moving average before the selloff begins.
The monthly S&P 500 E-mini futures chart reversed up strongly in late March (see below). That put a big tail on the bottom of the March candlestick.
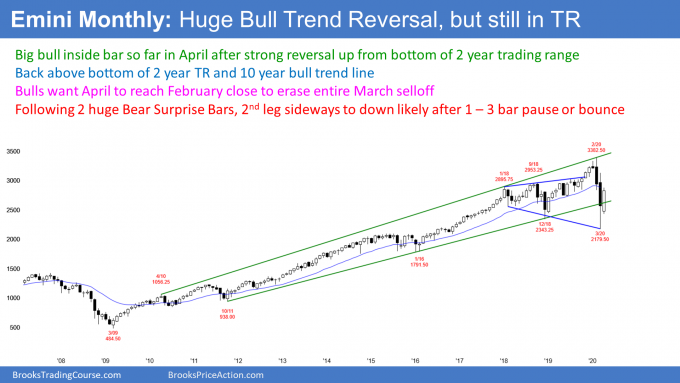
The reversal has continued through April. April so far is a big bull bar closing near its high. The bulls want April to close above 2939.75. That is the February close. If April closes above that price, the bulls will have totally reversed the March collapse. That would be a sign of strong bulls and increase the chance of sideways to up prices over the next couple months.
However, the die is cast. Those two huge bear bars in February and March were a major surprise. Because they are so dramatic, there is a 70% chance of a second leg sideways to down at some point this year. There is only a 30% chance that the bull trend will continue straight up to a new high.
High 1 bull flag
This month is an inside bar in a 10-year bull trend. It is also a bull bar. April is therefore a High 1 bull flag buy signal bar for May. If April closes on its high, May will probably trade above the April high. That would trigger the monthly buy signal.
But those two huge bear bars make the context bad for the bulls. April is probably only a minor buy signal. That means if May triggers the buy by going above the April high, the rally will likely only last a bar (month) or two.
The odds are against a new high at least until after a second leg sideways to down. Consequently, although April is a buy signal bar, there are probably more sellers than buyers somewhere above its high and below the February high.
The weekly E-mini S&P 500 futures has rallied for five bars (weeks) from a V bottom on its weekly chart (see below). Only 20% of V bottoms grow into bull trends. As strong as this rally has been, it is still likely to be a bull leg in a trading range.
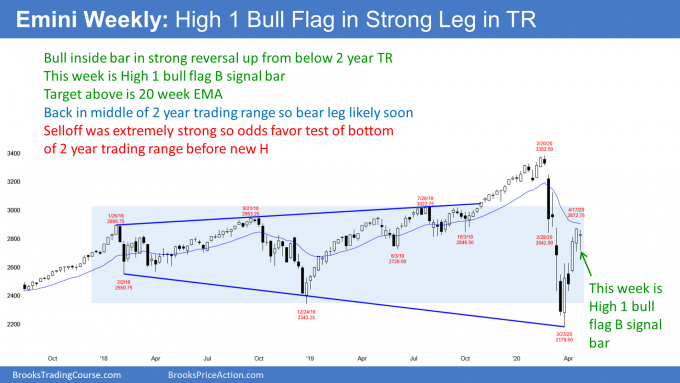
That means that there will be a bear leg. The rally retraced more than 50% of the two-month selloff. It is also near the resistance of the 20-week EMA.
Also, five months without a pullback is getting excessive for a leg in a trading range. Consequently, traders should expect a two- to three-week pullback to begin within a few weeks.
Strong rally, but pullback soon
Last week was the fifth bar in the micro channel. Traders have been so eager to buy that they have been buying above the low of the prior week. They will be very happy to buy below the low of the prior week when they finally have the opportunity. Therefore, there are probably buyers below last week’s low.
Last week was an inside bar in a bull trend. It is therefore a High 1 bull flag buy signal bar for this week. Also, there is room to the magnet of the 20-week EMA just above. This makes it slightly more likely than not that this week will go above last week’s high. That would trigger the buy signal.
But this week was only a doji bar. That is a weak buy signal bar. Also, the five-bar bull micro channel is unsustainable and therefore climactic. Finally, the buy signal is coming from just below the resistance of the 20-week EMA. Therefore, traders should expect more sellers than buyers above last week’s high. Those sellers will be at and just above the 20-week EMA.
If this week goes above last week’s high, which is likely, the breakout will probably only last a week or two. Traders should then expect a two- to three-week reversal down. A reasonable target would be about a 50% correction. That is around 2500 to 2600.
The rally has been strong enough to expect at least a small second leg up. Therefore, the bulls will probably buy again below 2600.
V bottom leg in a trading range
It is important to remember that a rally from a V bottom only has a 20% chance of growing into a bull trend. Therefore, there should be a test down soon. But the rally has been strong enough to make a second leg up likely.
These repeated legs up and down are the early signs of a trading range. This developing range will probably be between 2500 and 3000. It is within the 2.5-year trading range between 2200 and 3400.
The January 2018 rally was the most extreme buy climax in history on the daily, weekly and monthly charts. Traders should expect this 2.5-year trading range to continue for the decade. There will probably be at least one new high and low. Traders should expect the 10-year range to expand and be between 1800 and 3600.
The E-mini futures chart formed a bull inside bar in a five-week bull trend on its daily chart Friday (see below). That is a High 1 bull flag buy signal bar for today. Remember, on the weekly chart, last week was also an inside bar and a High 1 bull flag buy signal bar.
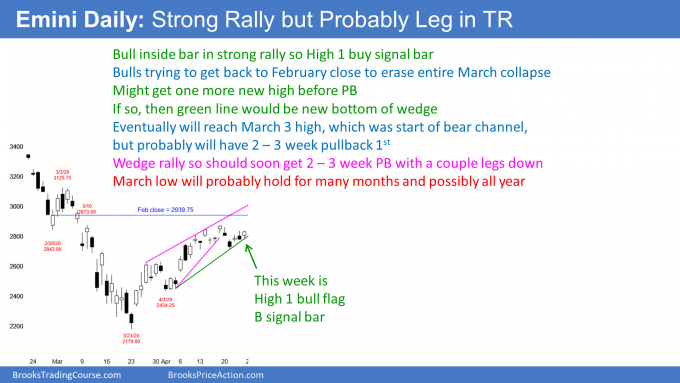
There are already three legs up in the five-week rally on the daily chart. That means there is a wedge, which is a type of buy climax. Buy climaxes tend to attract profit takers and bears willing to short. But if there is one more leg up and then a reversal, the wedge would be more convincing. That would attract more sellers.
The wedge top on the daily chart has a bad shape. As a result, many bears are hesitant to sell and many bulls are continuing to buy. They think the rally will continue at least a little higher.
In addition to the bad shape of the wedge on the daily chart, the weekly chart has a buy signal bar this week. Also, the 20-week EMA is a magnet just above. These factors make it slightly more likely that there will be one more leg up on the daily chart before a two- to three-week selloff to below 2600 begins.
V bottom but probable leg in a trading range
As I discussed in the section on the weekly chart, the E-mini is reversing up in a V bottom. Only 20% of V bottoms grow into bull trends. Traders know that the rally is likely to end soon. But until there is a clear top at resistance, the bulls will continue to buy.
This reversal has gone a long way and lasted a long time. Since traders believe it is not the start of a trend, they expect a bear leg to begin soon. There is almost a 50% chance that it is already underway.
Because the rally has been so strong, there will be many bulls who will be eager to buy the first pullback. Consequently, it will probably only last two to three weeks. It might retrace about half of the rally.
The rally is a Spike and Channel Bull Trend. Traders expect the eventual reversal to test the start of the channel. That is the April 1 higher low. But that is far below and the rally has been extremely strong. The first reversal down will probably not fall that far.
What are alternative targets? A common one is a test of the breakout point. That is the March 31 high of 2629.50. Another is a 50% correction. There is also the gap above the early April 3 day island bottom. These are all in the 2500 to 2600 area and that makes a pullback to that level likely.
What happens next week?
If the selloff to below 2600 has already begun, the bears should be able to create at least a couple big bear bars. It is more likely that the weekly chart will control the E-mini over the next two weeks. Traders should expect one more test of the 20-week EMA this week. Since the weekly buy signal bar is weak and the rally is extreme, traders should then look for a two- to three-week correction to below 2600 to begin a week or two later.
Trading Room
Traders can see the end of the day bar-by-bar price action report by signing up for free at BrooksPriceAction.com. I talk about the detailed E-mini price action real-time throughout the day in the BrooksPriceAction.com trading room. We offer a two-day free trial.


