
Several retail sector stocks hit by Coronavirus sell-off have bullish technical patterns, reports Suri Duddella.
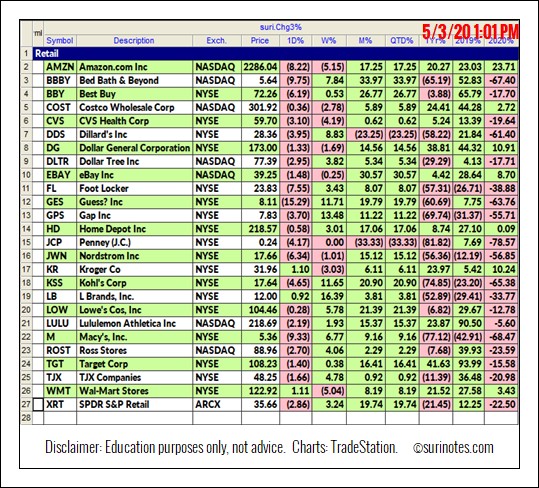
Most retail stocks fell during the Coronavirus crisis as most shops are operating online, and their future remains uncertain. There are few retail stocks that have done well in 2020, including Amazon (AMZN), Costco (COST), Kroger (KR) and Walmart (WMT), but many retail stocks have fallen precipitously. A few stocks may be presenting opportunities as they show reversal chart patterns like bullish Inverse Head & Shoulders.
Here is a list of Retail stocks and their performances in year 2020:
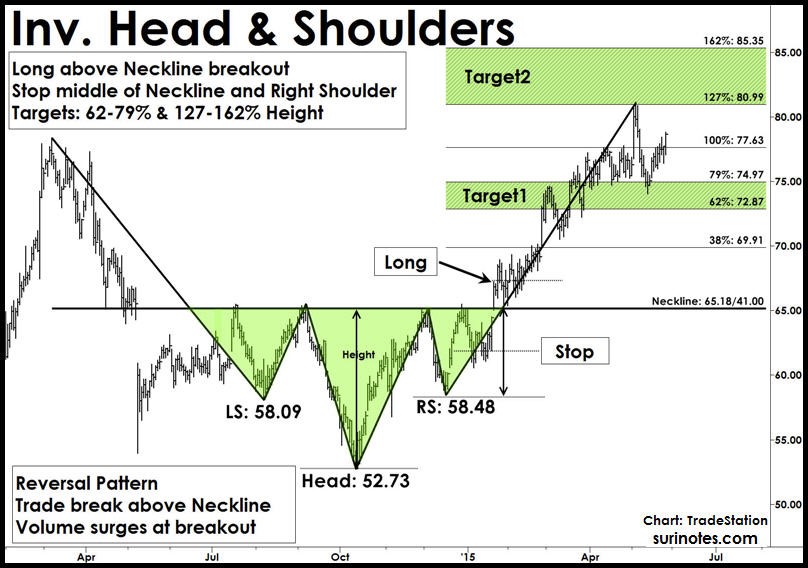
Inverse Head & Shoulders Pattern
One of the most popular chart patterns in market analysis is the "Head and Shoulders" pattern. The Head and Shoulders pattern forms near market tops in an established sideways to up-trending or bullish markets. It is a reversal pattern as it reverses its prior uptrend and follow a bearish or downtrend from its breakdown. These patterns are signified by three successive peaks (tops) resembling two shoulders on both sides and a head in the middle. The head is the largest of the three peaks.
An Inverse Head and Shoulders pattern is the head and shoulders pattern upside down (mirror image) and follows a similar structure and trading rules in reverse. The Inv. H&S patterns are also reversal patterns and form in established downtrends.
Trading Inverse Head & Shoulders Patterns
Entry: After right-shoulder formation and pattern completion, if price closes above the neckline with increased volume, enter a long trade above the breakout bar's high (see chart below).
Stop loss: 1. Place a stop below the middle of neckline and right-shoulder, 2. Place a final stop below the low of the right shoulder.
Targets: Targets are projected from the neckline level. Measure the height of the head and use Fibonacci ratios to compute targets.
The first target is 62% of the height of the head, and the second target range is 127% above neckline.
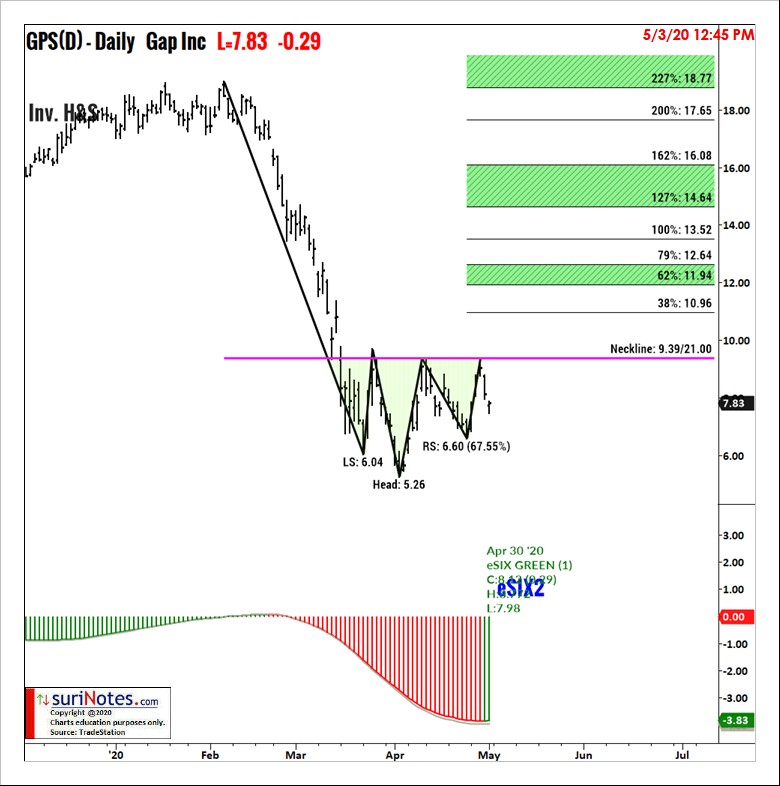
Gap Inc.
In February 2020, after reaching a high of $18.99, Gap Inc. (GAP) started to decline during the Coronavirus related market sell-off and formed an Inverse Head & Shoulders pattern between $5.26 and $9.39. The pattern neckline is $9.39. If prices close above $9.33 with underlying trend confirmation, a long trade may be entered with price targets of $10.96, $11.94 and $12.64. A stop is placed at the mid-level of right shoulders' low and neckline at $7.70.
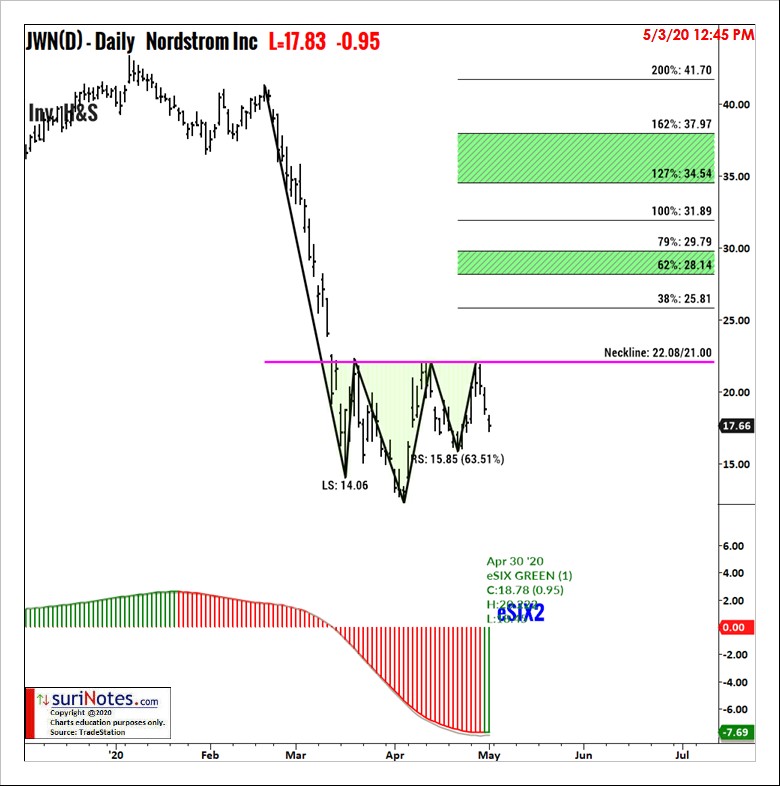
Nordstrom Inc.
Nordstrom Inc. (JWN) started to decline during the Coronavirus related market sell-off and formed an Inverse Head & Shoulders pattern between $12.27 and $22.08. The pattern neckline is $22.08. If prices close above the neckline with underlying uptrend confirmation, a long trade may be entered with price targets of $25.81, $28.14 and $29.79. A stop is placed at the mid-level of right shoulders' low and neckline at $18.50.
Target Corp.
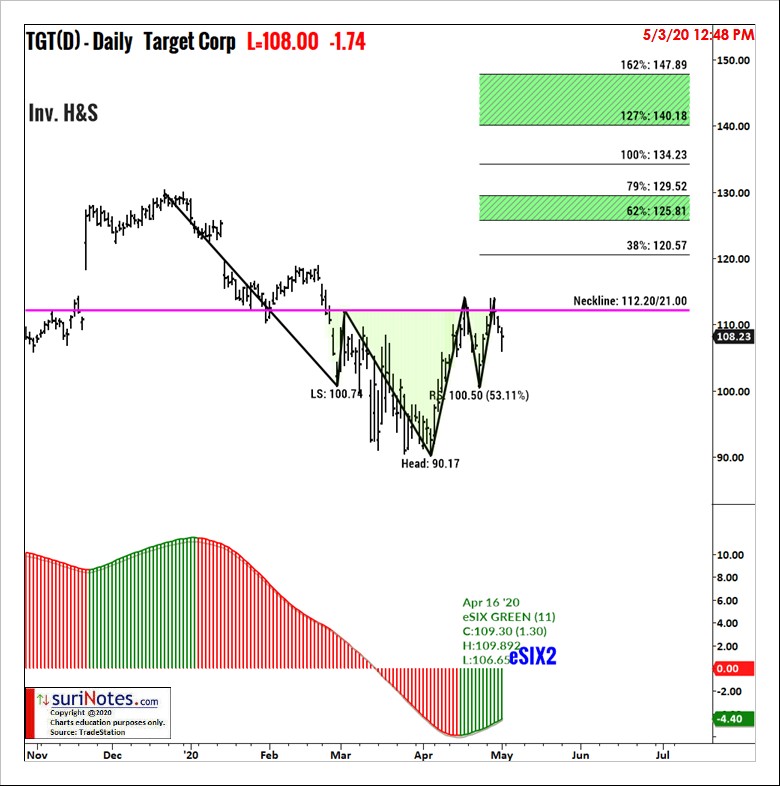
In December 2019, after reaching a high of $129.95, Target Inc. (TGT) started to decline during the Coronavirus related market sell-off and formed an Inverse Head & Shoulders pattern between $90.17 and $112.20. The neckline is $112.20. If prices close above $112.20 with underlying trend confirmation, a long trade may be entered with price targets of $120.57, $125.81 and $129.52. A stop is placed at the mid-level of right shoulders' low and neckline at $106.
Find more of Suri’s work at surinotes.com.


