
Crude oil is looking to rebound, but it is important to understand the structure of ETFs to get the most of your investment, reports Joon Choi.
This year has not been kind to equities, but they are faring far better than crude oil. The commonly quoted West Texas Intermediate (WTI) crude oil was at a high of $63.23 in early January but traded below $0 for the first time (as low as -$37) during futures expiration on April 20. Investors did not want to take delivery of physical oil, so they were willing to pay futures market participants $37 a barrel to get out of the contract obligation. As of this writing WTI crude oil was trading at $25.73 which represents a 59% fall from its January high. I believe prices are about to experience a significant rise in the coming weeks and I will discuss the reason for my forecast in this issue.
Oil benchmark overview
WTI refers to crude oil that is produced from Texas and is the main oil benchmark for North America and NYMEX’s oil futures. The other benchmark is Brent crude oil, which is tied to two thirds of the world’s oil contracts and which comes from the North Sea region. Although these two crude oil prices track one another closely, Brent crude tends to be a few dollars higher than WTI.
Oil ETFs
Even though crude oil market is very liquid, retail investors cannot trade spot crude. As a result, two exchange traded funds (ETFs) were rolled out to meet the investors’ demand for investing in crude oil. United States Oil Fund LP (USO) was launched on April 12, 2006 and Invesco DB Oil Fund (DBO) debuted on Jan. 1, 2007. They both have a partnership corporate structure, so owners of these ETFs are issued K-1 tax documents used to report profits and losses from their investments in limited partnerships. As a result, investors may have to report and annually pay taxes on gains, even if the security has not been sold.
In the earlier days, investors did not mind waiting for and filing additional tax forms as prices soared 135% for DBO and 145% for USO in approximately an 18-month period (from January 2007 to July 2008) while the SPDR S&P 500 ETF Trust (SPY) lost 9.3% during the same time period. However, over longer periods these ETFs lagged the broader market as measured by SPY and the energy sector as measured by the Energy Select Sector SPDR Fund (XLE) by a large margin. While SPY gained 7.4% per year since January 2007, XLE, DBO and USO experienced annualized losses; -0.8%, -10.1% and -20% respectively (see chart 1 below). Why did the oil ETFs lose so much value?
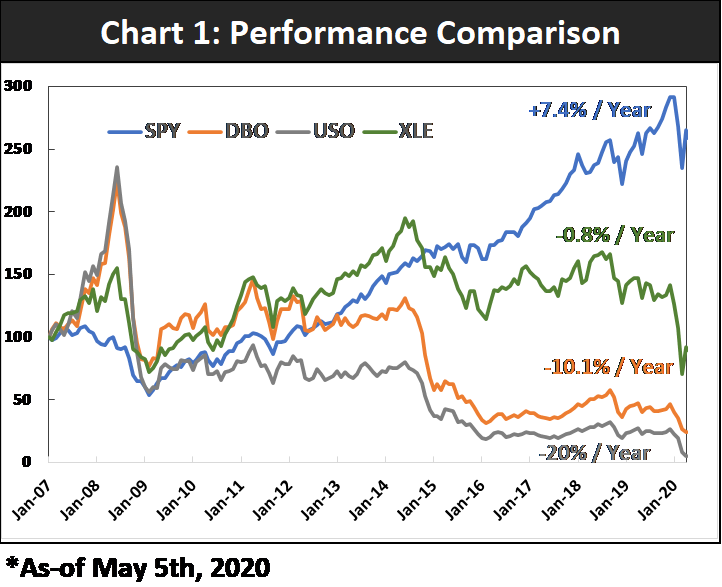
Both ETF vehicles invest in the WTI crude oil through oil future contracts which means that as time passes they must roll the expiring contracts to ones that expire later. For example, if USO holds June oil contracts, its manager rolls the expiring contract to the nearest month contract (July in this example) as we approach the expiration date for June futures contracts. In this way the ETF maintains the same number of barrels of oil in its portfolio even as futures contracts expire.
Every time the ETF (DBO or USO) replaces futures contracts near expiration with contracts that expire farther into the future, it incurs expenses for the ETF because the longer dated contracts usually trade at higher oil prices than near-dated contracts. This is called contango. The higher oil price implied in far-dated contracts includes not only the cost of buying the oil but also of storing it until the future delivery date.
USO follows a passive management approach by rolling into the nearest month. However, DBO managers choose to roll their expiring contracts in whatever month they feel will serve the investor best. This approach has led to better results in the long run, especially during recessionary periods like the financial crisis and in the last few months. So why do investors still use USO over DBO? One reason is that USO’s liquidity is approximately 8.5x DBO’s (measured by asset under management of $3.5 billion vs. $415 million). In addition, USO tends to be more volatile, offering greater profit potential. I do not recommend either of these ETFs as a long-term investment, but they can be great candidates for trading purposes.
Bullish Chart Formation
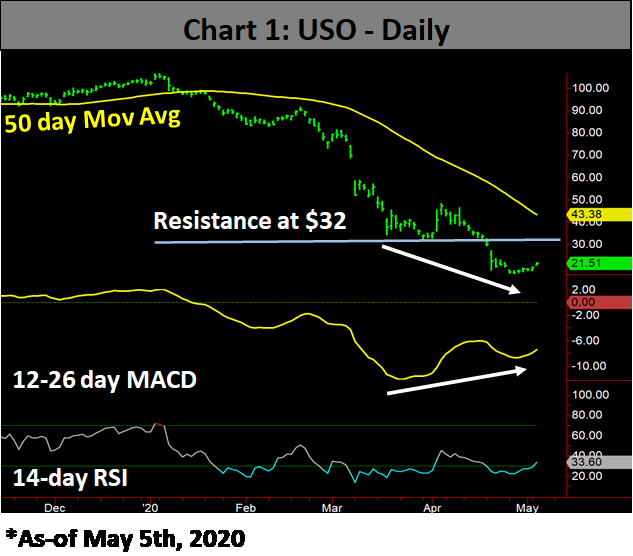
The USO daily chart below shows lower price lows last week compared to the end of March while the 12-26 day moving average convergence/divergence (MACD) indicator put in higher lows during the same period. This is called a positive divergence and is a good indication of future higher prices. In fact, USO may reach major resistance level of $32 in the near future. That is almost 50% in potential profit.
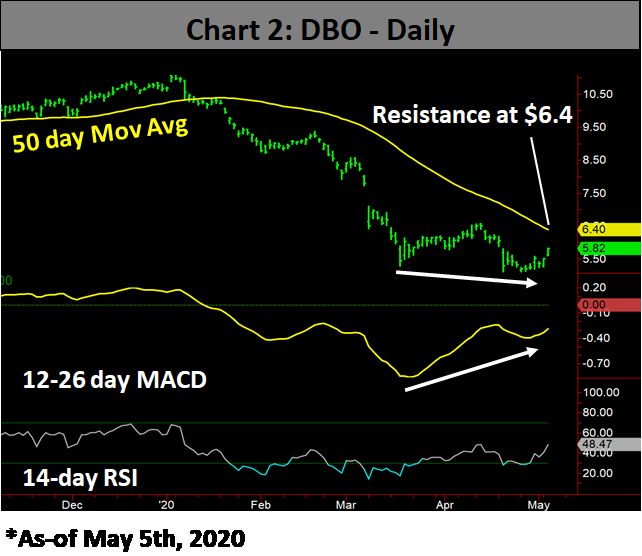
DBO also formed a positive divergence versus its MACD (see chart below) but has a much lower price resistance than USO’s (in percent from current prices). The ETF’s 50-day moving average of $6.40 is likely to serve as a major resistance which is only a 10% gain from its May 5 closing price.
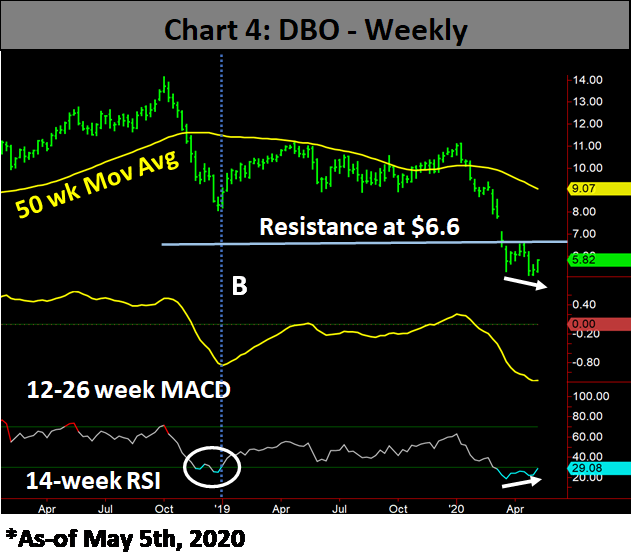
Bullish Chart Formation – Weekly
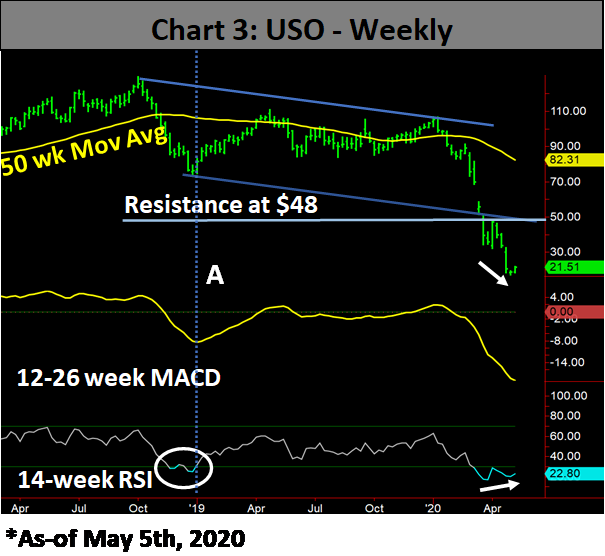
USO weekly prices formed a positive divergence versus its 14-week relative strength index (RSI) in chart 3 below. The weekly MACD has yet to turn up, which indicates the ETF is in the early stage of its potential rally. I say this because historically when MACD turns up after a steep decline, the underlying product has already appreciated significantly. There was a similar pattern after the correction in 2018 when USO made a double bottom in its 14-week RSI (albeit it was not rising) before its MACD turned up (Point A). This trade would have netted 40% in three and half months. Now the weekly RSI is rising, indicating that this trade could have better potential than in 2019. Therefore, I have a target price of $48 for the next few months, almost a 123% appreciation from May 5 close.
The DBO weekly chart below is also displaying the same positive divergence formation versus its 14-week RSI (Point B). However, my target price of $6.60 is only 13.4% from its May 5 close. Notice its resistance is at the same April high level but much closer because DBO did not fall as much as USO in the past five weeks.
Conclusion
Although we are in uncertain times as we cannot accurately measure the effects of COVID-19 on global economies, crude oil prices may have fallen too far too fast. Hence, oil prices may be on the brink of a major move up and you may be able to capitalize on potential profit by using USO and DBO. Waiting for and filing a K-1 could be a nuisance but it may be worth the tradeoff because positive divergence formations in their daily and weekly charts are pointing to higher prices in the coming weeks. I recommend USO since it has a much higher profit potential than DBO. Due to the volatile nature of the USO, I would put a 10% stop-loss on the trade. Please refer to your tax advisor for effects of a K-1 on your tax filing. I will keep you posted on this trade in future issues.
Joon Choi is Senior. Portfolio Manager/Research Analyst at Signalert Asset Management. Sign up here for a free three-month subscription to Dr. Marvin Appel’s Systems and Forecasts newsletter, published every other week with hotline access to the most current commentary. No further obligation.


