
Both Elliott Wave Analysis from Avi Gilburt and Fibonacci analysis from Carolyn Boroden suggest that the S&P 500 made a major bottom in March, but is also near a temporary top.
There are times when the market provides us with clear indications. And, as proceeded through March, Carolyn Boroden and my work were focused on the S&P 500 region just below 2200 as a potential bottom. Specifically, Carolyn had key price parameters in the 2165-2193 region, and the bottom of my support region was pointing towards 2187, with my next lower support below at 2160.
(Carolyn Boroden, the Fibonacci Queen, has joined the analyst team at Elliottwavetrader. So, she and Avi Gilburt are combining their perspectives to outline market expectations over the coming weeks.)
My expectation at the time was that the market was going to hold the 2187 support and rally towards the 2650-2725 from there.
Carolyn identified a confluence of multiple Fibonacci time cycles that came due between March 24-26 and calendar day projections that came due on March 22 and 23.
As we now know, a potential bottom for the market was struck at 2191.86 on March 23.
At the time, neither of us were certain that the bottom struck on that day would be a lasting bottom, but we both recognized there was strong potential for that to be the case. My expectation was that the market would rally from the 2200 region towards 2650-2725. And, once we were able to exceed that 2725 resistance, that opened the door to the market having struck a major bottom.
While the smaller degree structure is a bit questionable, both Carolyn and I see potential for the SPX to exceed the 4000 mark. In the near term, if the market holds above support at 2760, there is strong potential for us to continue higher towards the 3234.
However, Carolyn’s next time cycles are coming due right now on May 29, which suggests that we could see some a near-term top within the 3065-3085 area, to be followed by a test of support (see chart below).
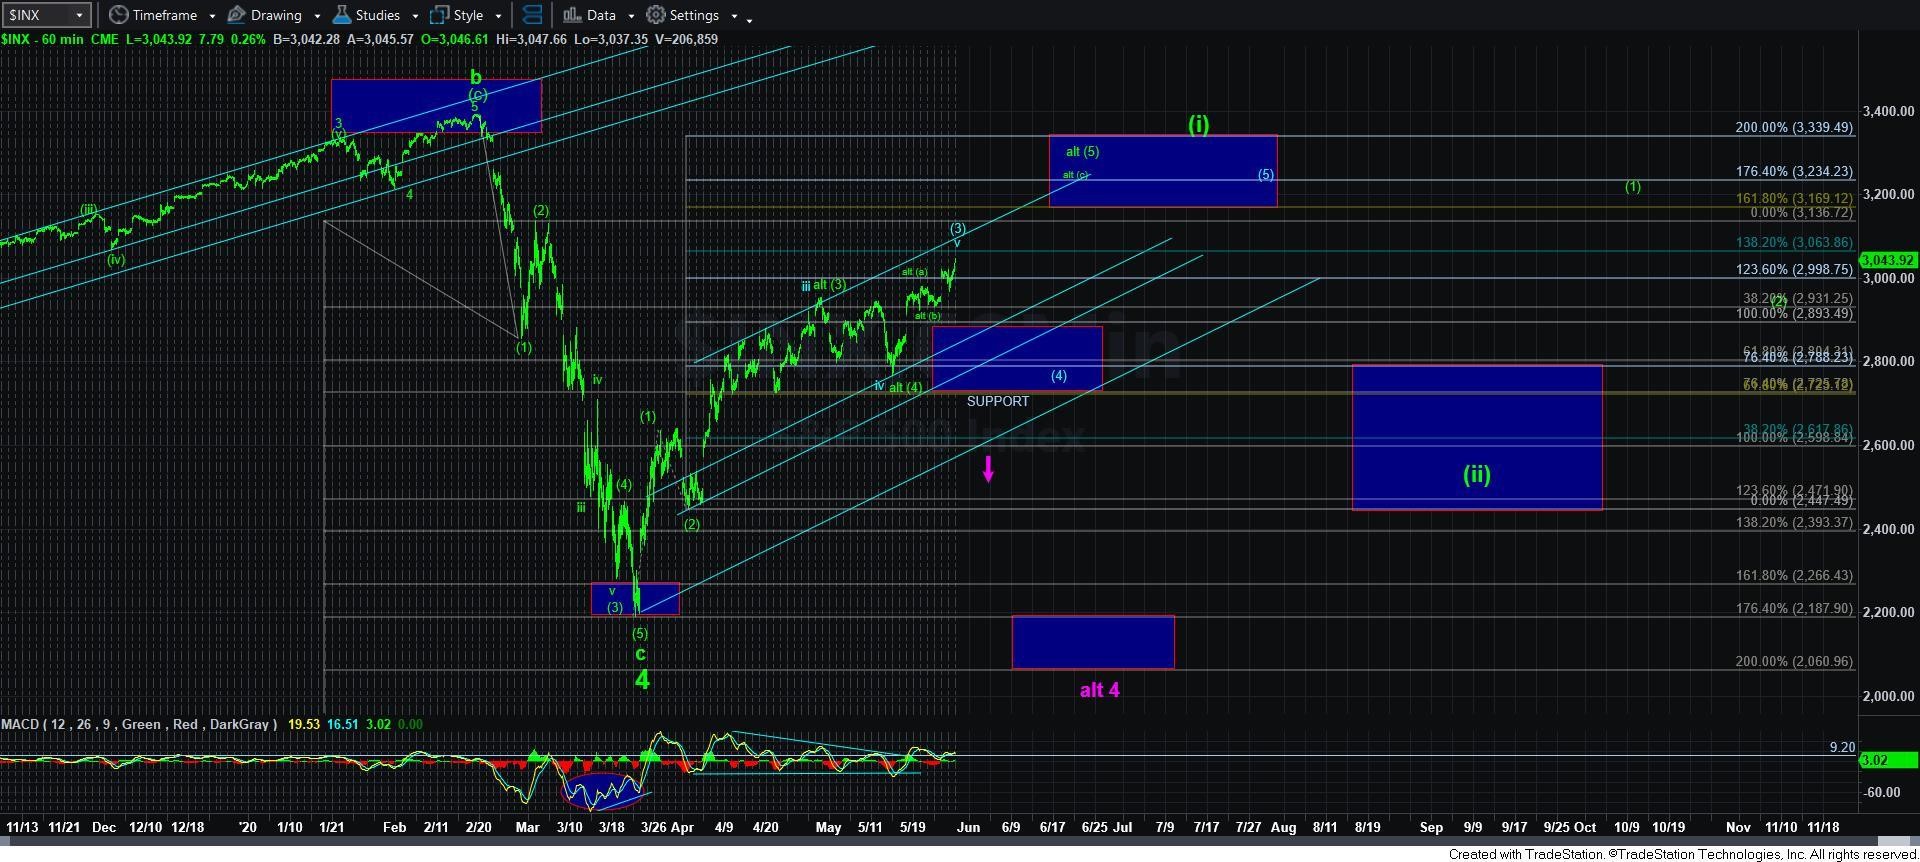
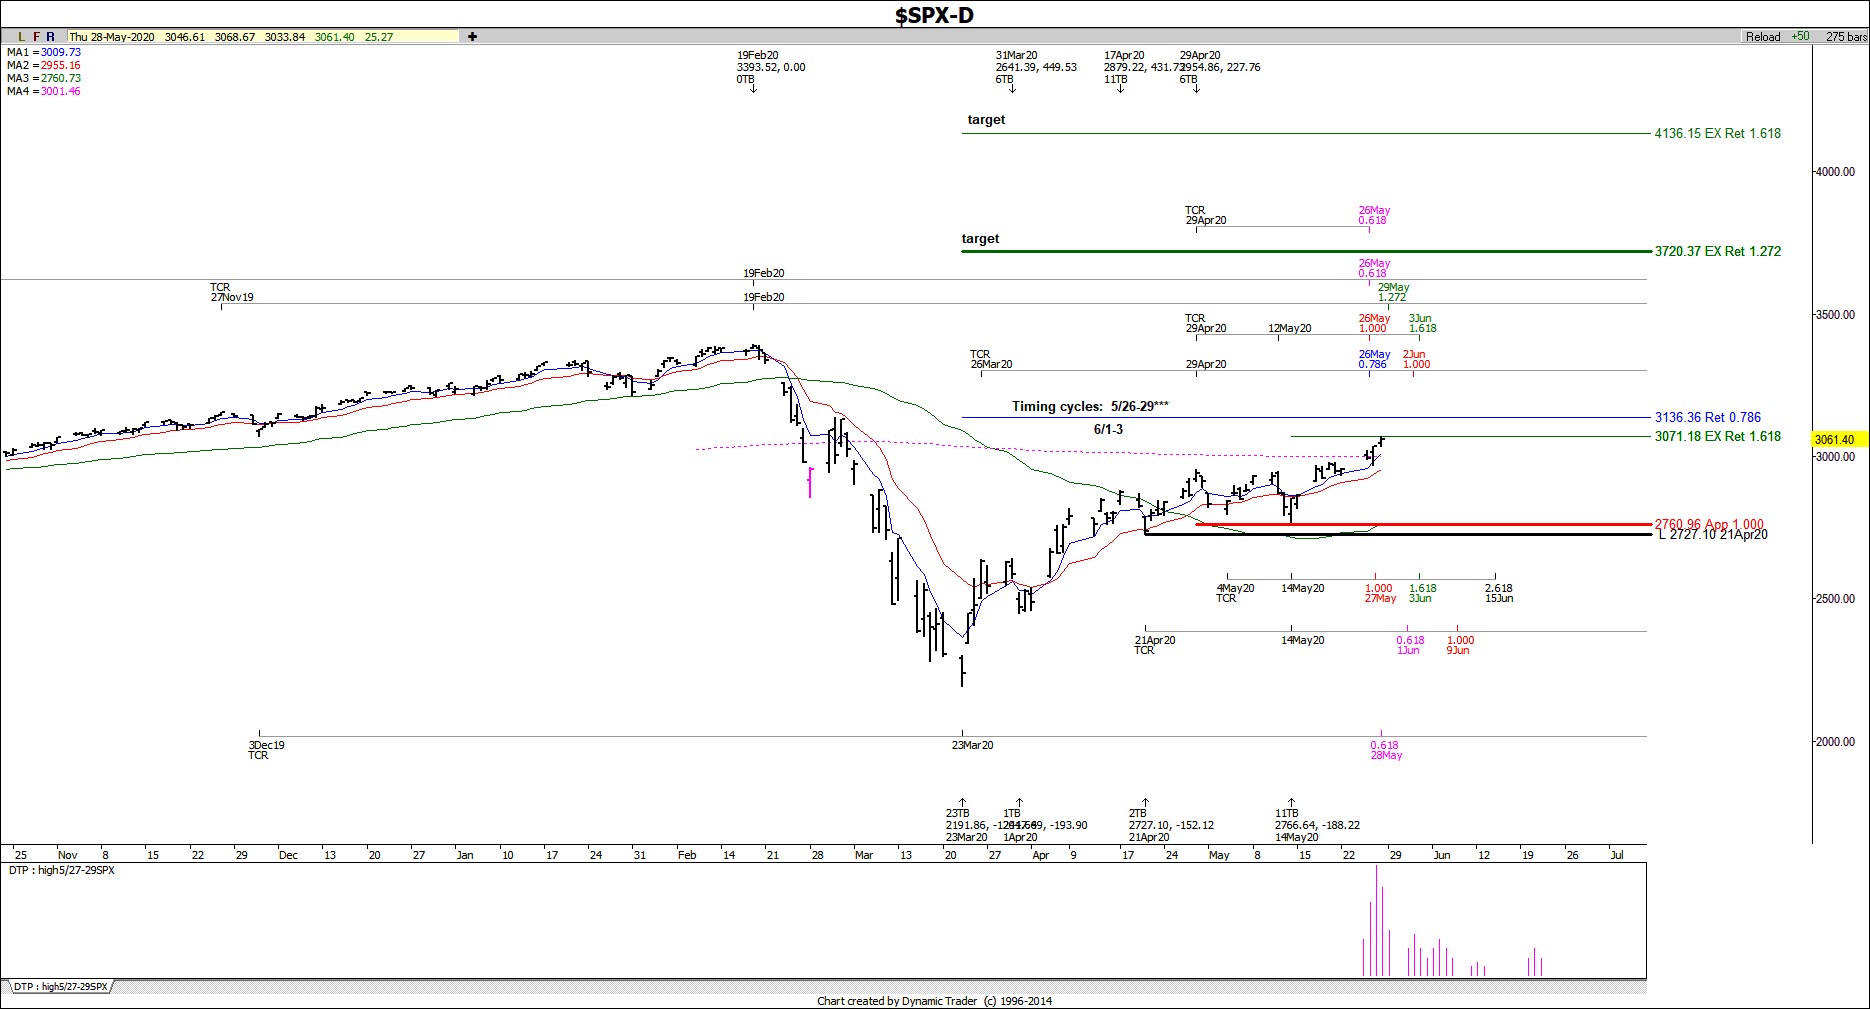
Both of our analysis suggests that the market has struck an important bottom back in March. And, if pullbacks continue to hold support, our combined analysis seems to be pointing towards a move to 4000 and potentially even higher in the coming years.
Avi Gilburt is a widely followed Elliott Wave analyst and founder of ElliottWaveTrader.net, a live trading room featuring his analysis on the S&P 500, precious metals, oil & USD, plus a team of analysts covering a range of other markets.
Carolyn Boroden is a technical analyst specializing in Fibonacci analysis. She authored: “Fibonacci Trading: How to Master the Time and Price Advantage.” Her work can be found on fibonacciqueen.com, elliottwavetrader.net and realmoney.com.


