
While last week’s reversal is bullish for the long bond, it may not signal new bull trend, reports Al Brooks.
The U.S. 30-year Treasury bond futures reversed the previous week’s sell-off last week. It is back in the middle of its three-month trading range. Traders expect more sideways trading, even if the market rallies next week.
The long bond futures weekly chart reversed last week (see chart). For the bulls, last week was simply a sharp pullback to the 20-week exponential moving average. The bond futures are now back in their two-month tight trading range.
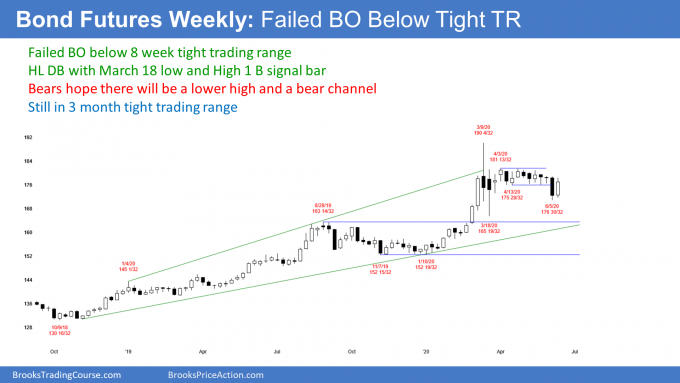
For the bulls, this week is now a buy signal bar. They see last week’s reversal as a failed breakout below a tight trading range and a triangle.
Furthermore, last week is reversing up from a higher low double bottom with the March 18 low. They want last week to be the start of a resumption of the January to March rally.
Is this a resumption of the bull trend?
What do the bulls need to do to convince traders that the bull trend is resuming on the weekly chart? They need many more bars in the trading range and then a strong breakout above that trading range. Then, traders will think that the bulls might get a new all-time high.
Alternatively, the bulls need a strong break above the March high. Then traders will wonder about a measured move up, possibly based on the March range.
At the moment, there is a 70% chance that last week’s reversal will be just a leg in the three-month trading range. There is only a 30% chance that it will lead to a series of bull bars and a break above the March high.
Strong reversal, but monthly does not confirm
While the reversal on the weekly chart is strong, the monthly chart is a problem for the bulls (see chart below). The reversal down in March was strong. Additionally, the three-month rally was the most extreme buy climax in history on the monthly chart. A three-bar (month) pullback is probably not enough to lead to a resumption of the bull trend. Traders wanting to buy typically expect a couple legs sideways to down and lasting about 10 bars.
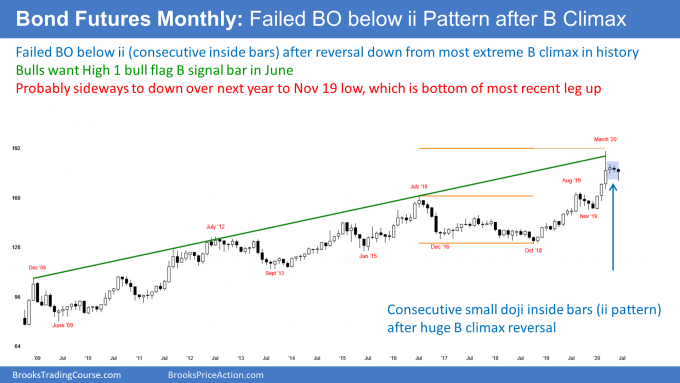
On the monthly chart, that means about a year. Therefore, this week’s reversal up will probably be the start of a bull leg in the trading range that began three months ago and not of a resumption of the 20-year bull trend.
Trading Room
Traders can see the end of the day bar-by-bar price action report by signing up for free at BrooksPriceAction.com. I talk about the detailed E-mini price action real-time throughout the day in the BrooksPriceAction.com trading room. We offer a two-day free trial.


