In 2019, the Utilities and Energy sectors had performed well but ranked near the bottom of overall Sector exchange traded funds (ETFs) performances (see chart below).
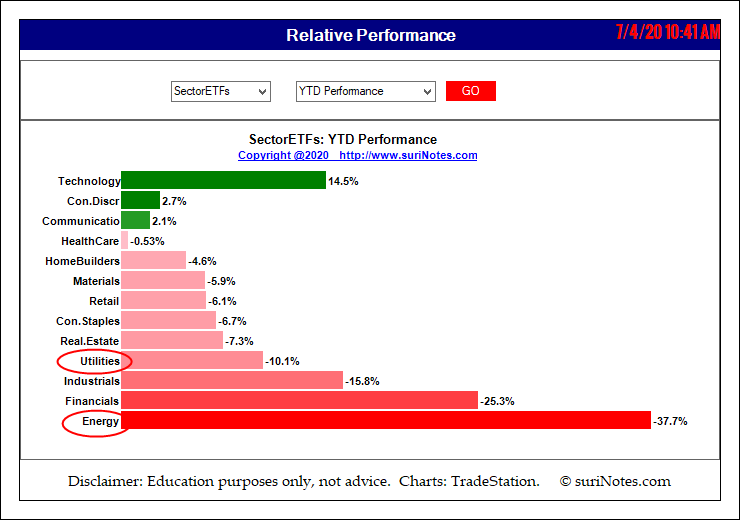
Many analysts thought 2020 might see the energy sector boost, but until the middle of 2020, these sectors had significantly underperformed. Some utility and energy stocks are trading in rectangle channel patterns after making a bottom and providing some trading opportunities.
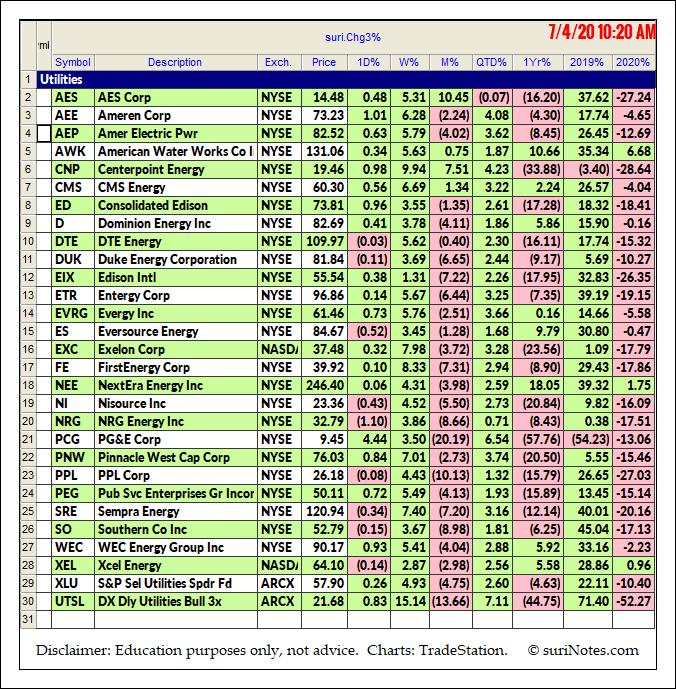
Below is a list of utility sector stocks and their performance in 2019 and 2020, as well as
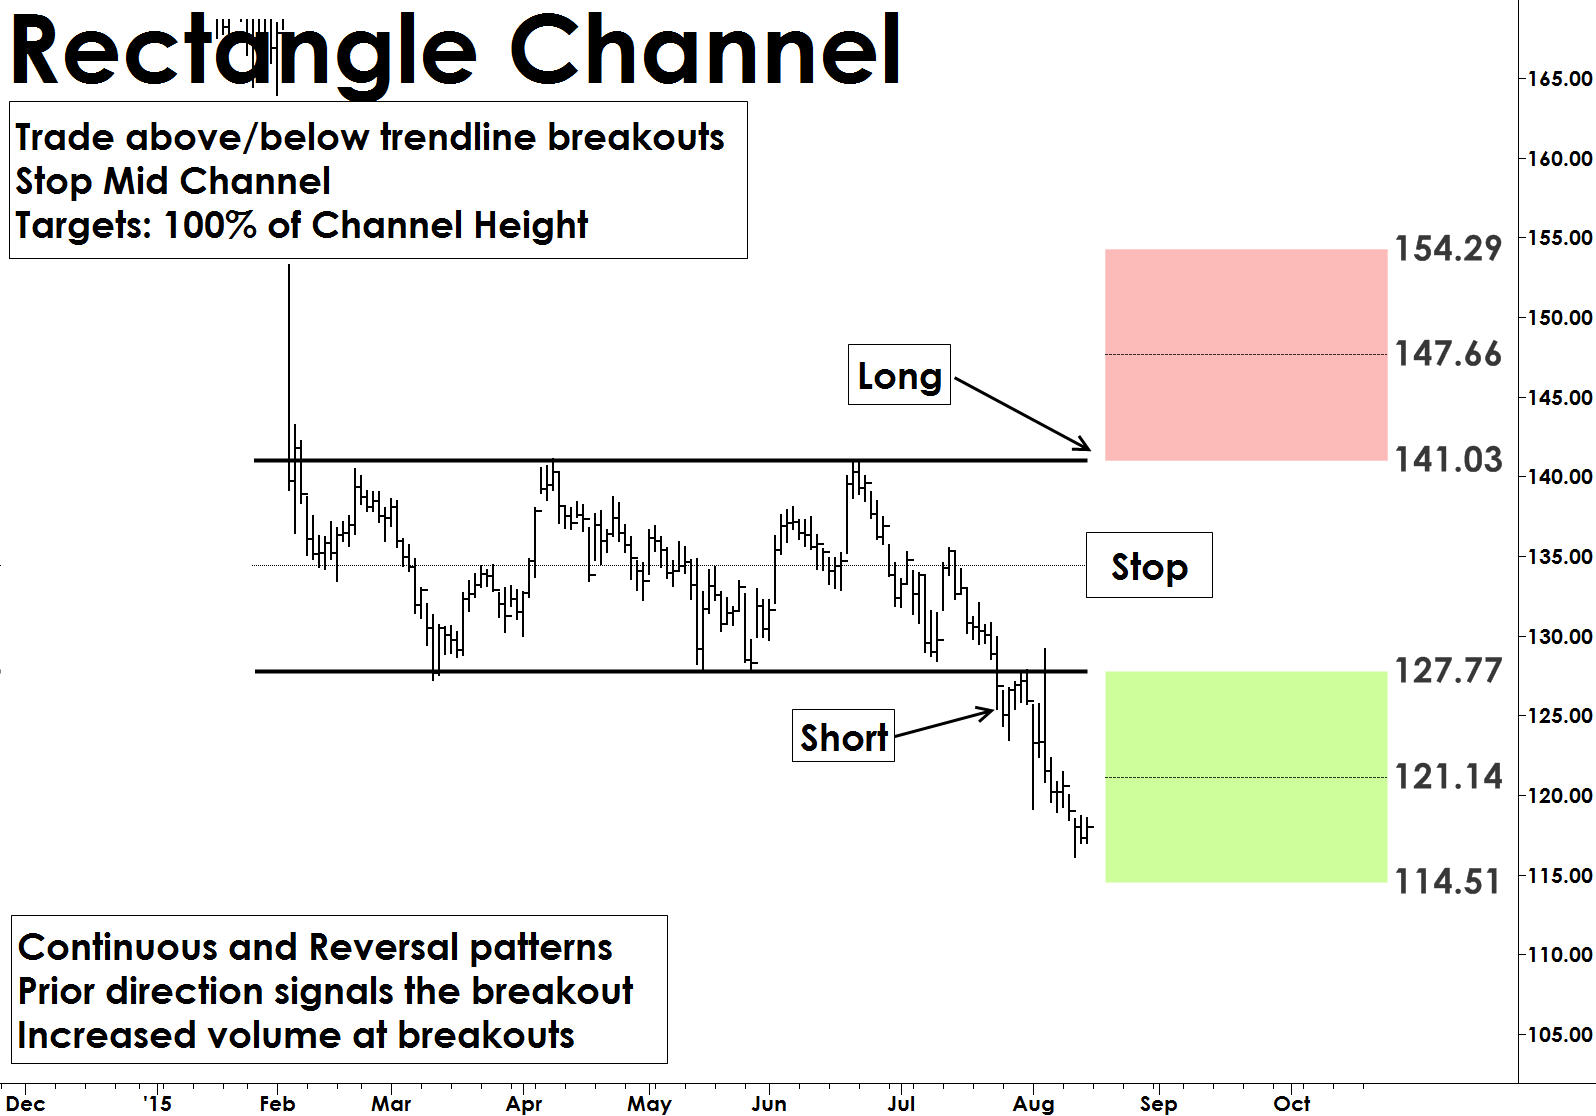
Trading Rectangle Channel patterns
Rectangle Channel patterns are formed by price action between two key trendlines bound by multiple equal highs and lows. The duration of the pattern can be few days to months. Longer duration patterns are, typically, more reliable. The pattern must have at least two pivots (equal highs or equal lows) on each of the trendlines. The price breakout can occur in any direction from the pattern but is often stronger when it breaks out in the trend that existed before the pattern formation. The volume inside the pattern is non-decisive, but volume tends to increase during the breakouts.
Trade: A trade setup occurs when price closes outside the trend line (upper or lower) at least two bars signaling a breakout. Trades are entered on a follow-up bar at high above the breakout bar or low below the breakdown bar.
Target: Targets in Rectangle Channel formations are based on the depth of the rectangle pattern. Targets are usually set at 70% to 100% of the depth of rectangle from the trade entry.
Stop: Rectangle patterns fail when prices retrace into the middle of the rectangle channel. Place a stop order just below the middle of the channel (see chart below).
Rectangle Channel Examples
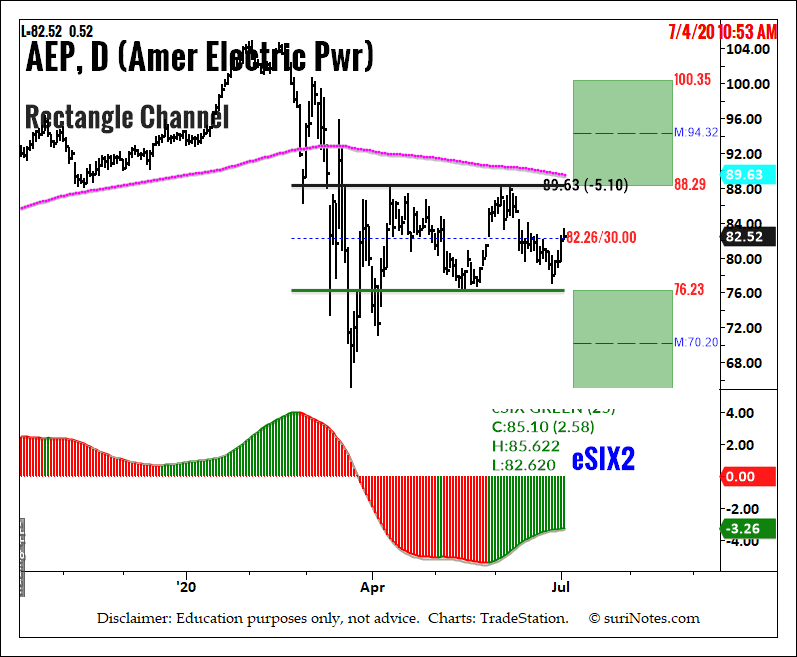
AEP Rectangle Channel Pattern
American Electric Power’s (AEP) daily chart shows a Rectangle Channel pattern formation with a bullish underlying trend. Currently, price is trading between upper and lower trendlines. The Rectangle channel's upper trendline is at $88.29, and the lower trend line is at $76.23. The mid-channel level is $82.26 and channel depth is $12.10.
A long trade may be entered if price breaks above the upper trendline with a stop below the mid-channel level. The breakout targets are: $94.30, $100.40; breakdown targets are $70.20 and $64.20.
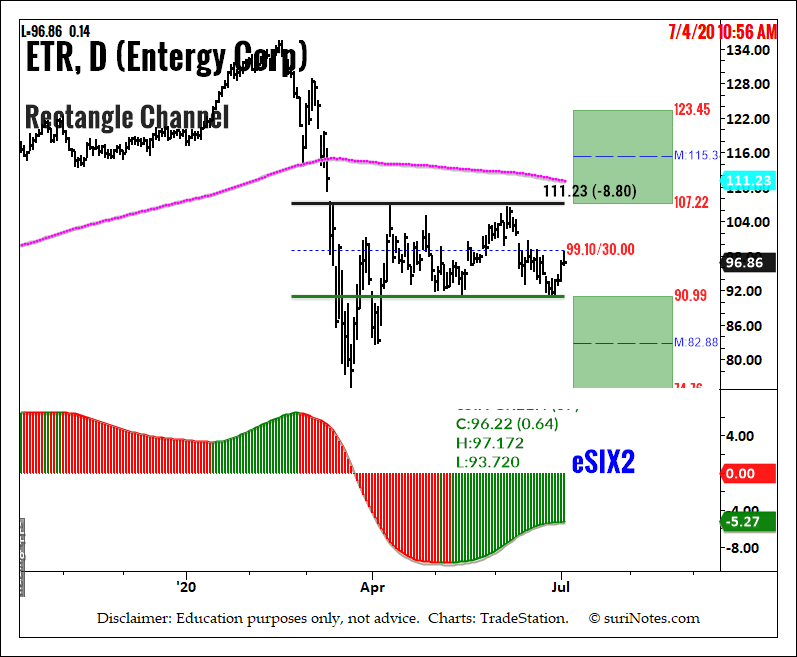
Entergy Corp. Rectangle Channel Pattern
Entergy Corp.’s (ETR) daily chart shows a Rectangle Channel pattern formation with a bullish underlying trend (see chart below). Currently, price is trading between upper and lower trendlines. Rectangle channel upper trendline is at $107.22 and the lower trend line is at $90.99. The mid-channel level is $99.10 and channel depth is $16.20.
A long trade may be entered if price breaks above the upper trendline with a stop below the mid-channel level. The breakout targets are $115.30 and $123.50, breakdown targets are $82.90 and $74.80.
Utilities Select Sector SPDR Fund
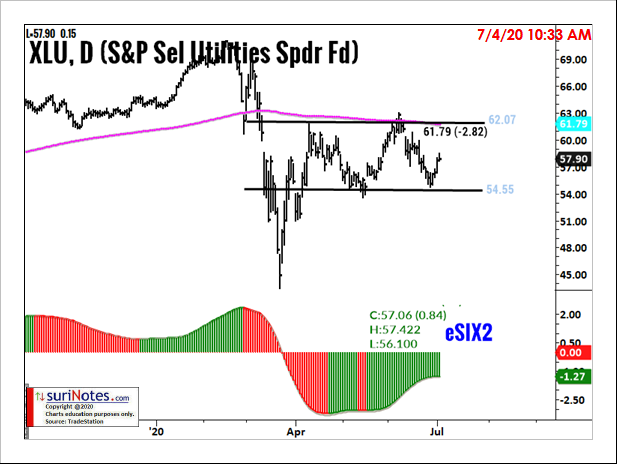
The Utilities Select Sector SPDR Fund (XLU) is in Rectangle Channel Pattern (see chart below). XLU's daily chart shows a Rectangle Channel pattern formation with a bullish underlying trend. Currently the price is trading between upper and lower trendlines.
Rectangle channel upper trendline is at $62.07 and the lower trend line is at $54.55. The mid-channel level is $58.31 and channel depth is $7.52.
A long trade may be entered if price breaks above the upper trendline with a stop below the mid-channel level. The breakout targets are $65.83 and $69.59; breakdown targets are $50.79 and $47.03.
Watch Suri’s archived presentation “How to Trade Chart Patterns With Market Context,” from Friday June 12 as part of the New MoneyShow Virtual Event. Find more of Suri’s work at surinotes.com.