
Garrett DeSimone compares the current market environment next to other recent shocks using the volatility risk premium.
The S&P 500 clawed back its losses since hitting its Covid-19 induced low in late March. Its recent remarkable rally ranks as one of the best 50-day runs of all time, helping the S&P 500 to finish with a positive quarter, recovering near 25% since mid-April.
The past quarter’s positive S&P 500 is also extraordinary from a volatility perspective, and what we know about risk premiums. The volatility risk premium (VRP) is compensation investors receive for providing “insurance” against changes in market volatility. Financial theory dictates that risk-averse investors dislike changes in volatility and are willing to pay a premium to protect against it.
This notion manifests itself in the options market as implied volatility is trading at levels above historical volatility (see chart below). The VRP (Implied Vol – Historical Vol) is on average positive, indicating the profitability of the short vol trade. A larger VRP implies the larger the premium and profitability of a short vol position. However, implied vol occasionally undershoots actual vol, which represents losses to assets exposed to short vol.
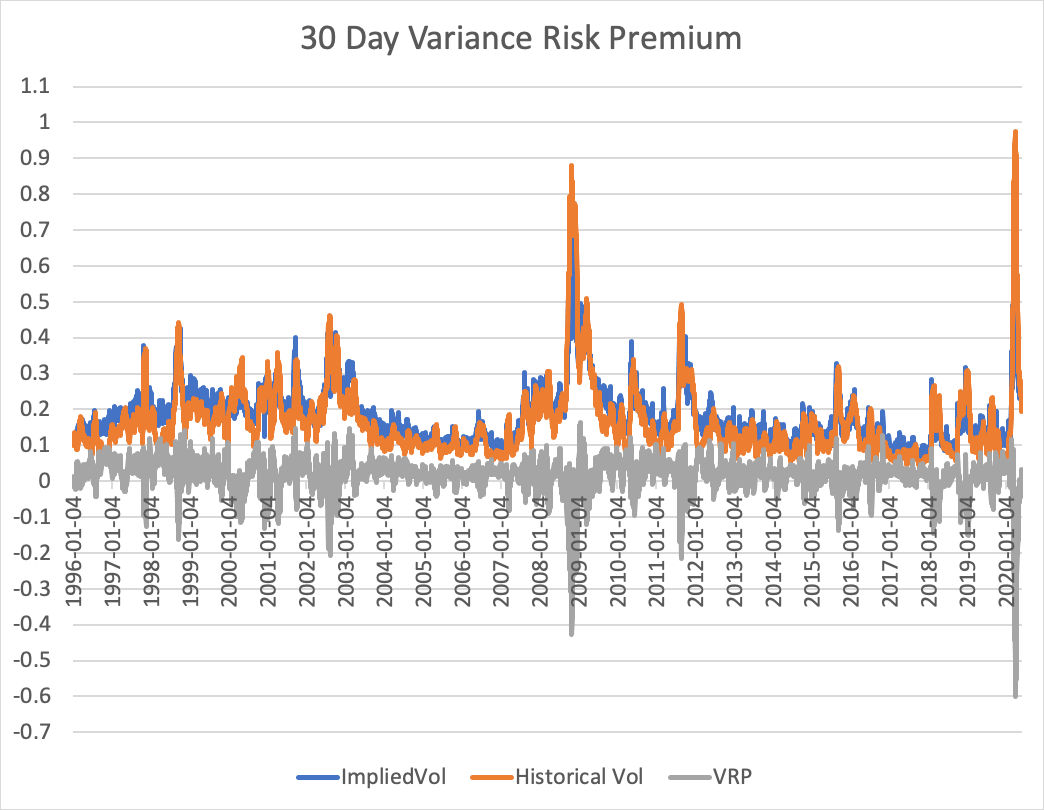
Source: OptionMetrics
The Variance Risk Premium (VRP) level turns out to be a strong predictor of overall market returns at an intermediate horizon. The economic intuition behind this is that implied vol embeds uncertainty regarding macro fundamentals, for which data materializes over a quarterly cycle. The chart below plots quarterly returns (overlapping) of the S&P 500 and the VRP level.
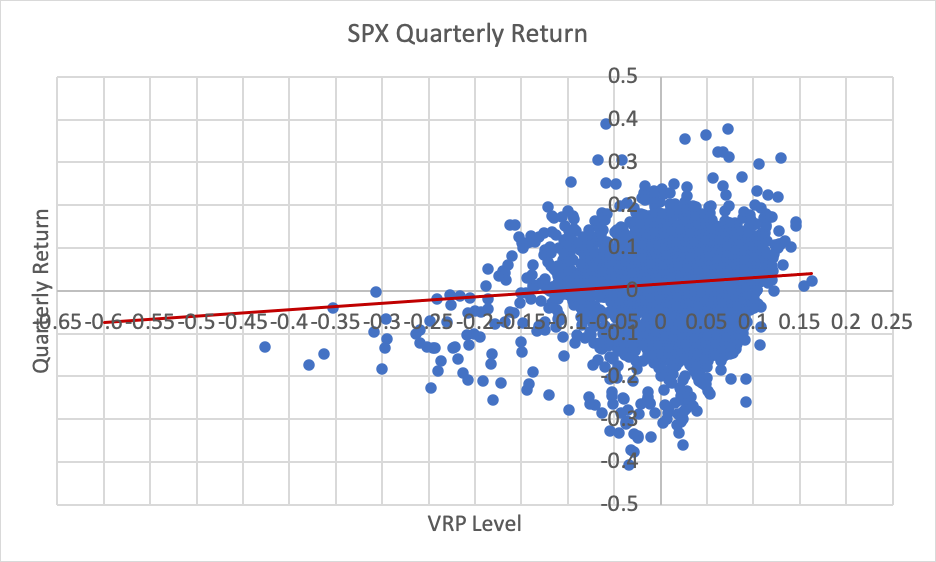
Source: OptionMetrics
It is important to acknowledge that any regression model only utilizing a single predictive variable for the aggregate market along with overlapping returns are going to contain inference issues. However, the simple histograms below demonstrate how different the return distribution become for positive and negative VRP values.
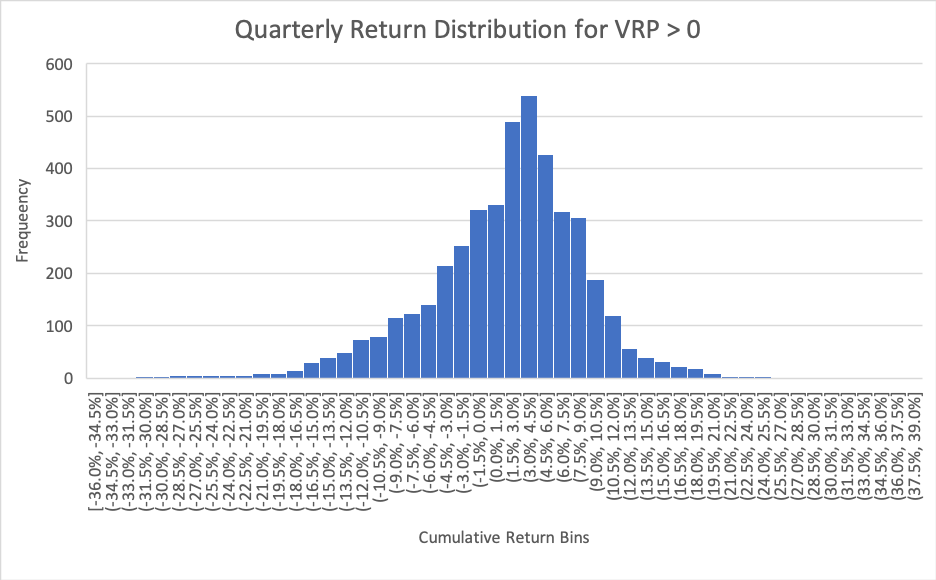
Source: OptionMetrics
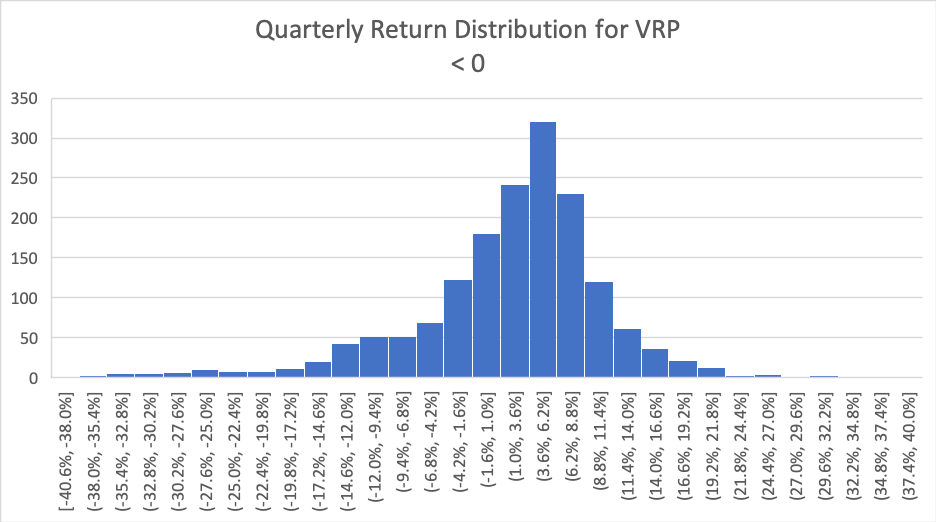
Source: OptionMetrics
It is evident that for negative VRP values, the distribution of the following quarters’ returns becomes significantly more skewed towards negative values. The skewness of returns when the VRP is negative is -1.04 versus -0.53 for positive. Simply put, downside risk becomes larger over the next quarter when the VRP enters negative territory.
However, the negative magnitude of the VRP clearly matters as well. The market has never posted a positive quarterly return when the VRP is below -0.2, until now. Extremely negative values are associated with widespread systemic financial distress. In these cases, financial intermediaries are completely tapped out of risk bearing capacity, i.e. they are unable to take on short volatility positions due to risk constraints.
There are four notable historical cases when the -0.2 threshold was breached: the selloff of 2002, the Financial Crisis of 2008, the Sovereign Debt Crisis of 2011 and the most recent Covid-19 selloff. These previous events were consistent with extreme economic and financial turmoil, along with lasting damage for institutions.
This time is extraordinary for the VRP. The VRP bottomed out on 4-17 at its lowest level of -0.59, but the quarterly return was positive. A possible explanation is the limited number of extremely negative observations produced during the sample period may not be representative of the true distribution of quarterly returns following catastrophic events. Regardless, the Covid-19 selloff remains a prominent exception to pricing of variance risk.
Garrett DeSimone, Ph.D., is Head of Quantitative Research at OptionMetrics


