
The S&P 500 could face a major correction once it tests the gap near the market top, reports Al Brooks.
The E-mini S&P 500 bulls are determined to test the gap on the weekly chart above the Feb. 24 high. Many bears have been waiting for that test. Once in the gap, there is a 50% chance of a new high and a 50% chance of a correction down to 2700.
The monthly E-mini S&P 500 futures chart has rallied for four months from the below the bottom of its three-year trading range. It is now just below the top of the trading range (see chart below).
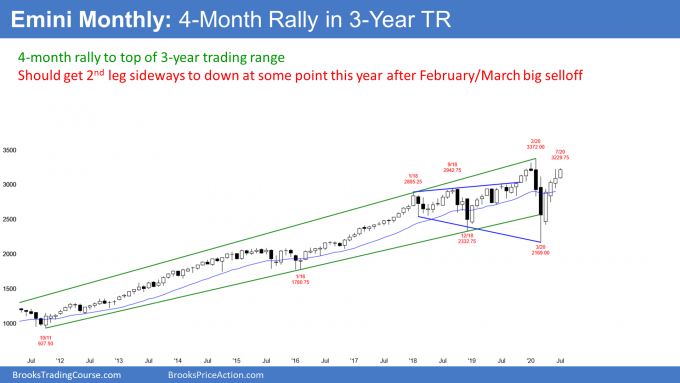
I have made the point many times that the size of the candlestick bodies has been shrinking from April through June. That is not what bulls want to see. The shrinking bodies represent a loss of momentum.
If you are a bull, you want the rally to continue to far above the old high. Ideally, you want the bodies to stay big or even get bigger. Also, you want each bar to close on or near its high. That indicates that traders are buying right up to the final days of the month. They do that because they are confident of higher prices in the next month. Because that did not happen in June, there might be more sellers than buyers above the June high.
Shrinking bodies and a big tail on top of a bar, like June, indicate that traders are selling before the end of the month. The selling is a combination of bulls taking profits and the bears betting on a reversal down.
Why would the bulls take profits if they believe the next month will be higher? They wouldn’t. Consequently, a lot of bulls are unwilling to take that bet. This hesitation on the part of the bulls increases the chance of a reversal back down to the middle of the three-year range.
In a trading range, traders expect reversals
When the stock market is in a trading range, traders expect reversals up from around prior lows and down from around prior highs. There is often a breakout before the reversal. That happened with the February high and with the March low. Therefore, if there is going to be a reversal down this summer, it might come from above the February high instead of from a lower high.
I have written many times that the small body in June and the big tail on top of the June candlestick made it probable that July would not close far above the June high. This is true even though July has broken above the June high.
The month is only half over, and the bulls can still get a huge bull bar in July. So far, July is trading at the high of the month. But there are two weeks left and the month can look very different once the candlestick closes.
For example, June had a big bull body early in the month. It reversed down strongly on June 11 and never got back to the high of the month. This created the big tail on the top of June’s candlestick by the end of the month.
The weekly E-mini chart has been in a bull trend for four months (see below). The V bottom rally is now near the February all-time high, which is also the top of a three-year trading range.
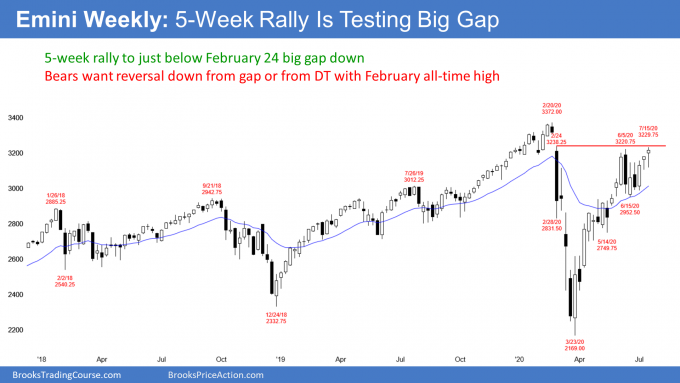
There was a huge gap down on the weekly and daily charts on Feb. 24. Since that time, I said that a huge gap at the start of a strong bear trend is an important magnet. I thought that the E-mini would get back there within a couple years. Instead, it is reaching the target after just six months.
While the bears have been trying to get a reversal down for seven weeks, their attempts have failed. The E-mini is still in a four-month Small Pullback Bull Trend on the weekly chart.
Since early June, I have said that many traders will keep buying every reversal down because they expect that the E-mini cannot escape the magnetic pull of that gap. Why sell below the gap if you think that the E-mini will go higher and reach the gap?
Will the rally continue up to a new high? That really does not matter. Unless the E-mini breaks strongly above the old high, it will probably begin to turn down from somewhere above the Feb. 24 high. The top could be above or below the February high.
2 failed attempts at an island bottom
The E-mini did something subtle but important in both of the past two weeks. It gapped up on Monday. This formed a four-month island bottom with the February gap down. However, the gap closed by the end of the day, ending the island bottom. It did the same thing the week before.
It is very unusual to make two consecutive attempts at an island bottom and have both fail. This is important, but easy to overlook. It is a sign that something is wrong with the bulls.
The E-mini might gap up again on Monday, July 20. That would be the third consecutive week when the bulls tried to create a four-month island bottom.
Even if there is a gap up and it stays open all week, the location at the top of a three-year trading range is bad for the bulls. Therefore, the July gap up will probably close within a couple weeks.
These failed attempts at a strong bull breakout increase the chance of a reversal down this summer. However, it probably will not happen until after the E-mini tests into the gap above the Feb. 24 high.
Trading range price action since April
The candlesticks since late April are weaker than those of the first four weeks of the rally up from the March low. There have been many bars with prominent tails or bear bodies. Also, the E-mini went sideways for several bars in May and again in June.
This type of price action is more common when the rally will end up being in a trading range. The rally is probably a bull leg that will become part of a trading range. Traders therefore expect a bear leg to begin this summer.
Targets for the bears
If there is a bear leg, it could simply test down to the June 15 higher low. That is the bottom of a five-week trading range and the bottom of the most recent leg up. A trading range late in a bull trend is often the Final Bull Flag. Its low is a reasonable target for a retracement.
When a rally in a trading range reverses, the selloff often reaches the start of the trading range bars. That is the April 24 doji candlestick on the weekly chart. The low of that bar came on April 21.
Additionally, a bear leg in the three-year trading range should test down to around the middle of the range. That also is around that April 21 low, and that is about a 50% retracement of the four-month rally.
Finally, it is 20% down from the all-time high. If the market is 20% below the high, it is in a bear market. Therefore, that is also an important price. Markets like to test important prices. If there is a reversal down from around the Feb. 24 gap or the all-time high, traders will look for a move down to 2700 – 2800.
The daily E-mini futures chart has been in a weak rally since the June 15 low (see below). But it has also been sideways since early June. The bulls hope that the four-month rally will continue up to a new all-time high.
However, the bears expect a double top with the February all-time high. They do not care if the second high is a little above or below the February high. Legs in trading ranges often extend beyond the range before reversing. It would surprise no one if the reversal down came from a new high.
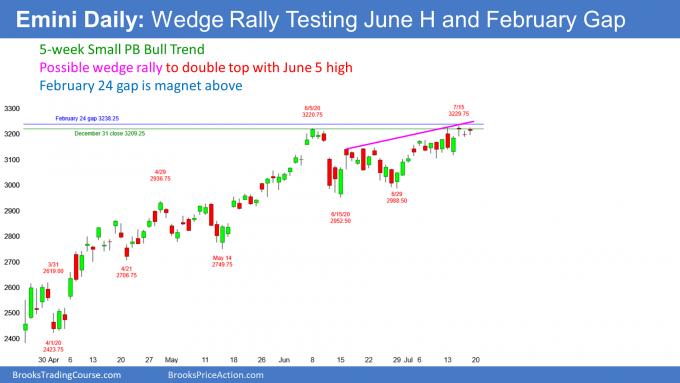
The bears believe that this rally is an exhaustive buy climax and that the three-year trading range is intact. Trading ranges have legs up and down. The bears see the four-month rally as just a leg in the three-year trading range and therefore are looking for a bear leg to begin soon.
The importance of the Feb. 24 gap
The gap above the Feb. 24 high is big and it was the start of the pandemic crash. It is therefore a very important price.
When the E-mini gets close to an important support or resistance level, traders like to see the move reach that level before looking for a reversal. Many bears feel this way. If enough do, there could be aggressive selling from above the Feb. 24 high.
The bears might wait a week or more to see if the break into the gap will be strong enough to continue up to a new high. But at some point, if the E-mini stalls, there might be strong selling. The bulls who bought wisely back in late March will take profits. Those who bought poorly in February will give up on their hope of getting out at their entry price, and they too will sell. Finally, many bears think that this rally will form a double top with the February high.
No one yet knows if the selling will be enough to begin a correction back down to the middle of the three-year range. However, whenever the market is deciding between a big breakout and a big reversal, traders assume that there is a 50% chance of either outcome.
Is July going to be the top for several months?
The timing of this is interesting. Since the E-mini got within 10 points of the gap last week, it will probably enter the gap in July. Also, there is a tendency for the market to have selloffs in the August through October time frame. The 1929 Crash and the 1987 Crash both were in October. Both crashes had more than a 10% selloff in August. We are entering that window. Also, as I said, the E-mini is overbought and it might try to become more neutral ahead of the election.
All of these factors favor a reversal down to the middle of the three-year trading range within a few months. Larry Williams, who is a well-known trader, uses his own reasoning to come to a similar conclusion. He recently said that he expects the market to rally to around the old high into around July 27 and then turn down.
But why is the market still going up? Liquidity. I have said many times that the single most important factor over the past four months is Federal Reserve Governor Neel Kashkari’s statement on 60 Minutes in March that the Fed has “an infinite amount of cash” to protect the economy. But as powerful as the Fed is, it will not bother to stop a 15% correction. Therefore, a pullback to 2700 can take place, despite the Fed’s proclamation.
Trading Room
Traders can see the end of the day bar-by-bar price action report by signing up for free at BrooksPriceAction.com. I talk about the detailed E-mini price action real-time throughout the day in the BrooksPriceAction.com trading room. We offer a two-day free trial.


