
The E-mini S&P 500 moved into the Feb. 24 gap, which could signal a downward reversal, reports Al Brooks.
The E-mini S&P 500 is stalling in the gap above the Feb. 24 high, as I said was likely. There is a 50% chance of a reversal down to the middle third of the three-year trading range beginning within a few weeks before there is a new high.
The monthly E-mini S&P 500 futures chart in July so far is a bull bar closing near its high with one week remaining (see chart below). It broke above the June high, but pulled back below that high at the end of the week.
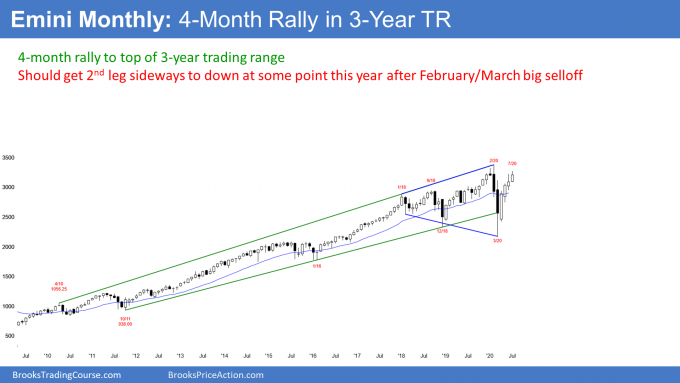
It is important to note that June had a big tail on top. That represents profit taking, which means that the bulls were less aggressive.
Also, May had a smaller body than April and June had a smaller body than May. Shrinking bodies is a sign of loss of momentum.
This is taking place near the top of a three-year trading range, which is resistance. The bulls can reestablish the momentum by having July close on its high and far above the June high. If the E-mini simply goes sideways for the final week of July, the monthly bar will be strong. Traders will expect higher prices in August.
This week is important
There is always a bear case. What happens if the tail on the top of June and the shrinking bodies are still important?
One sign of that would be if July closed far below the June high and had a big tail on top, like June. Traders would then see a micro-double top with the June high and a big double top with the February high. They would suspect that August might trade down.
Consequently, this coming week is important because it can affect what August does. If the bears can get a strong reversal down, it could lead to further selling in August. But if the bulls can keep the E-mini where it currently is, traders will look for a new all-time high in August.
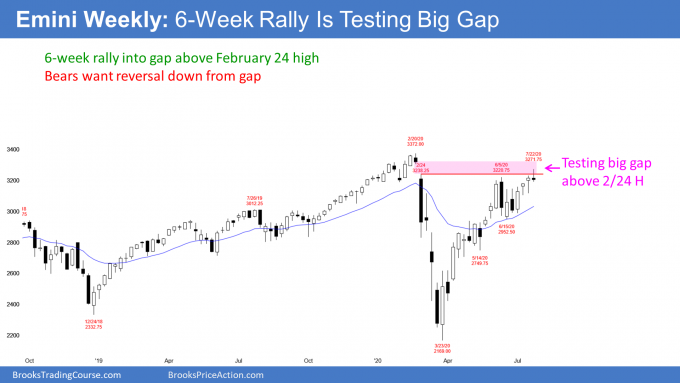
The weekly E-mini chart formed a bear doji bar last week (see below). The bears hope that the bulls will finally take profits now that the rally entered the February gap.
This week is a sell signal bar for next week. But because it only had a small bear body, it is not a high probably sell signal. This is especially true since the four-month rally is a Small Pullback Bull Trend. That is a strong bull trend and it resists reversing. The bulls still have a 50% chance that the rally will make a new high before there is more than a two-bar pullback.
The importance of the February gap
Ever since the gap down on Feb. 24, I have said that the gap would be an important price. It was a big gap down and the start of the Coronavirus crash.
For the past two months the E-mini was close to the gap. I therefore said that the E-mini would probably have to enter the gap before there would be a pullback that lasts more than a few days. Last week it entered the gap. That will catch the interest of bears who were waiting for the E-mini to get there.
We do not yet know that there will be enough selling to create a reversal. But we should find out within a week or two.
A big gap at the start of a trend is a strong magnet
Because it was a big down, we knew traders were very eager to sell. All of the bulls who bought in February were instantly holding losing positions. Many held through the crash and the V-bottom reversal up.
Since the gap was so unusually big and it led to a crash, traders see it as very important. Once the E-mini begun to get near it in June, many traders decided not to sell until after the E-mini entered the gap. That relative lack of sellers meant the market had to go higher to find sellers. How much higher? Well, into the gap. Many traders are interested in selling there.
Who is going to sell in the gap? Maybe everyone!
The E-mini finally entered the gap last week. Now we will find out what the bulls are thinking. Will the February bulls thank the heavens for allowing them to get out around breakeven? The four-month rally has made them whole again. Will they be so exhausted by the collapse and sharp rally that they will choose to exit and wait to see what happens?
Traders know that there were a lot of sellers at this price in February. Markets have memory. Will many bears think this is still price to sell?
Finally, the smart bulls who bought at the March low need to take profits at some point. Will they conclude that a 40% gain in four months is so exceptional that it is unlikely to grow much more in the coming months? Many will not want to give back their windfall profits. Those bulls will sell out of their hugely profitable longs.
Will there be enough of these three types of sellers to reverse the four-month bull trend? We might find out over the next few weeks.
How big will a pullback be?
If the E-mini repeatedly dips back below the Feb. 24 high (the bottom of the gap), or reverses down strongly, traders will look for a pullback. The first reversal down in a strong bull trend is typically a pullback and not the start of a bear trend. When there is a pullback in a bull trend, a good rule of thumb is to expect it to retrace about half of the rally and about last half as long.
A 50% pullback is around 2700. Half of a four-month rally is two months. Consequently, you can estimate what to expect if the E-mini is going to reverse soon.
Using my simple guide, the initial estimate for a possible end of a selloff would be a month or two down to 2700. It could last three weeks or three months, and the bottom might be at 2800 or 2600. No one knows, but this is a good starting point when looking for a pullback.
Another generalization is that a pullback from a buy climax retraces approximately half of the rally about half of the time. In 25% of cases, the pullback is more like one-third and in the other 25% of cases, it’s around two-thirds. That is why I said 2600 – 2800.
Over the past month, I have given many other reasons to expect a pullback to around 2700. I will not repeat them today.
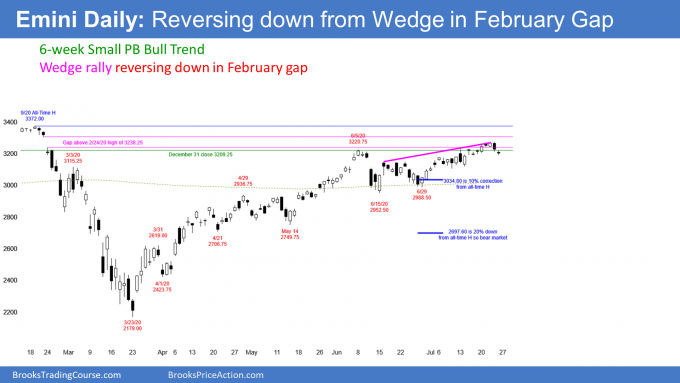
The daily E-mini futures chart had three consecutive closes this week above the Feb. 24 high. That means that they were in the gap.
However, Thursday reversed down from within the gap. Since the six-week rally has had three pushes up, it is a wedge and a buy climax. If the bears can get follow-through selling next week, they will probably get a reversal down to the middle of the three-year trading range.
But since the rally is still in a Small Pullback Bull Trend, the bulls still have a 50% chance of a new all-time high before there is more than a few days down.
I have been saying that once the E-mini entered the gap, there would be a 50% chance of a new high before there is a pullback lasting more than a few days. That is still true.
You often hear that all gaps close. However, the bulls have not yet closed the gap. Remember, for two months I have said that the E-mini should go above the Feb. 24 high. That means I was expecting it to enter the gap. I never said it should go above the Feb. 21 low, which would close the gap.
My thought was that traders thinking of selling in the gap did not care if it closed the gap. Besides, the top of the gap is very near the all-time high, which is a much more important price.
That is why I have only mentioned the bottom of the gap and the all-time high as major targets. If the E-mini were to close the gap, it would probably quickly continue up to a new high, and that is a more important achievement.
Do all gaps close?
There is an adage on Wall St. that says, “all gaps close.” It is important to understand that traders who have traded for decades (I have traded for 35 years) never use superlatives like always, never, all, or none.
Well, except one. I sometimes say, “Never say never or always.” That is because black swans exist, and unimaginable things happen. They happen rarely, but they happen. One of the tenets of quantum physics is that there is a real possibility for everything imaginable, even if it is so small that it is realistically impossible.
Back to gaps. Every bear gap in history has closed, and the February gap will close as well. How can I say that? The world’s population and the world’s wealth have increased forever. That means the value of the market has continued up, even after an 89% loss in the Great Depression. There always has been a new high. Therefore, every gap down gets closed.
But what about a gap up? The market has been in a bull trend forever. That means there have been many higher lows. If the market gapped up early in the rally from a low, that gap does not have to close.
How often do gaps close?
If you look back at daily and weekly charts over the past 100 years, you will see that every gap down eventually closed (the February gap will close at some point). And you would also find many gaps up that never closed and they never will close. If you just look at recent gaps up and down, about 70% will close within three years.
Gaps on the E-mini chart have become less important in recent years because so many institutions use 24-hour charts. They don’t see the gaps on the day session chart.
Also, there are far fewer gaps on continuation charts because the market is open almost without stop from Sunday night through Friday night. When there are gaps, they are more likely to come on Mondays after the market has been closed for a couple days. News can happen during the closure and it can result in a gap up or down. That means that Monday gaps can have more significance. For example, Feb. 24 was a Monday, and the gap down is present on both the daily and weekly charts.
How low can a pullback go?
It is important to note that the E-mini dipped back below the Feb. 24 high on Thursday. That is a sign of sellers in the gap. We do not know yet if the selling will be persistent and severe. We should find out within the next two weeks.
If it is, the first downside target is the bottom of the June trading range. A trading range is an area of agreement. Both the bulls and bears think the price is fair.
The E-mini is now above what everyone thought was a fair price. If enough traders think it belongs back within that trading range, it will probably test down to the bottom of that range, just below the 3000 big round number. At that point, traders will conclude that the July rally was just an extension of the June/July range instead of a resumption of the bull trend.
Possible head and shoulder top within 2 months
If there is a selloff to 3000 and then a bounce, traders will begin to talk about the possibility of a lower high and then a second leg down. The trading range at that point would contain a lower high major trend reversal sell signal. Also, it would be a head and shoulders top.
If that top were to develop, there would be a 40% chance of a break below the June low and then a measured move down. That would take the E-mini down to around the 2600.
That is just below the March 31 high, which was a breakout point. Pullbacks often test breakout points. This is especially true when the market is in a trading range. The E-mini has been sideways for almost three years.
If the E-mini were to fall that far, that would probably be the end of the pullback. There is only a 30% chance that a reversal down would go below the March low during the initial selloff.
Why 30% and not 10%? Because markets are always more balanced than you might think. The probability for everything that is reasonably possible hovers between 40 and 60%. Betting on a test of the bottom of the three-year range is not crazy. Therefore, the probability has to be at least 30%.
Mystery chart
This chart (below) had a huge bull trend that ended in March. It broke strongly to the downside in early April. After a pullback that formed a double top bear flag, it sold off in a wedge bear channel. The third leg down also has three small legs, so the selloff is a nested wedge. This has a higher probability of a reversal up.
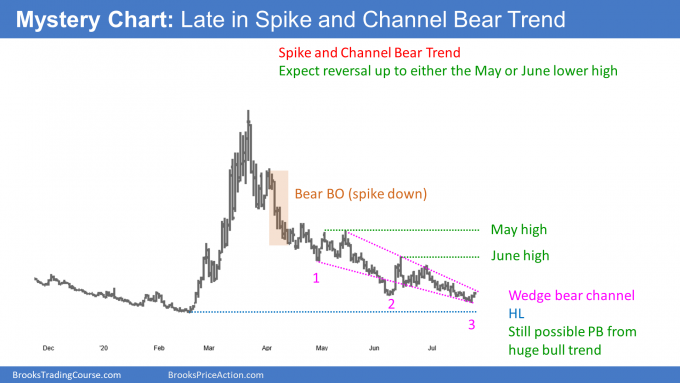
Bear channels usually have bull breakouts. Therefore, traders should expect a rally soon.
When a Spike and Channel Bear Trend reverses up, it usually tests either or both lower highs. Here, those are the May and June highs. It then typically evolves into a trading range.
It is important to note that the strong bear trend so far is holding above the February bottom of the bull trend. While it retraced almost the entire rally, it still could be just a deep pullback in a bull trend.
So what market is this? It is the E-mini, but I plotted it upside down. If you flip it over, you will see that the rally to the March high on this chart is the selloff to the March low on the E-mini chart.
Sometimes it’s easier to see what might be going on if you can look at the market from a different perspective.
Trading Room
Traders can see the end of the day bar-by-bar price action report by signing up for free at BrooksPriceAction.com. I talk about the detailed E-mini price action real-time throughout the day in the BrooksPriceAction.com trading room. We offer a two-day free trial.


