
Several cybersecurity stocks have signaled profitable V-bottom patterns, reports Suri Duddella.
As the technology industry grows with massive digital transformation, cloud and edge computing have increased Cybersecurity companies' demand. Cybersecurity is a science of keeping digital data through restricting access, firewalls, network and storage safety, and user authentication methods.
Some of the top cybersecurity companies are Palo Alto Networks Inc. (PANW), Fortinet Inc. (FTNT), Okta Inc. (OKTA), Crowdstrike Holdings Inc. (CRWD), Cyberark Software Ltd. (CYBR), Splunk Inc. (SPLK) and Zscaler Inc. (ZS). Traders can access a broad representation of the sector through the First Trust NASDAQ Cybersecurity ETF (CIBR).
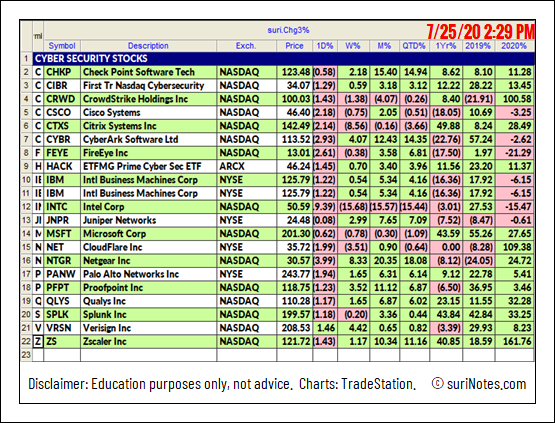
Here is a larger list of Cyber Security stocks and their performances in 2019 and 2020.
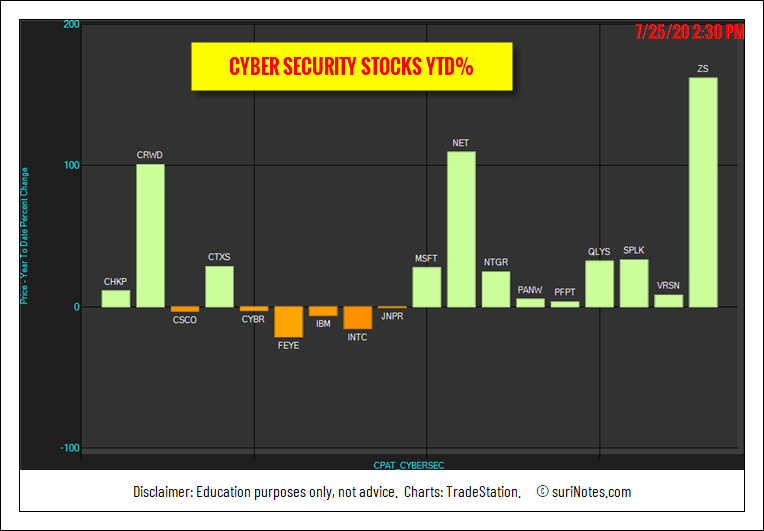
Cyber Security Stocks YTD% in 2020.
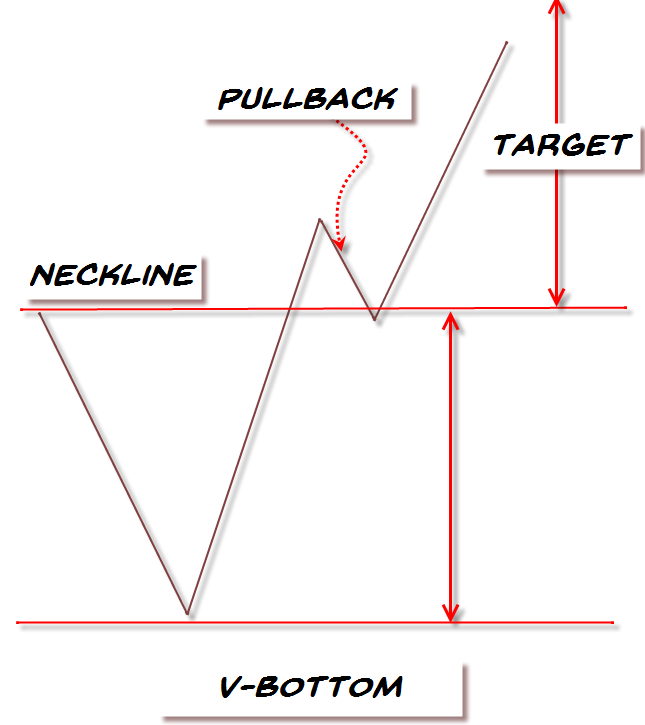
V Patterns
As the name implies, the "V" chart patterns have the letter "V" shape and prices shift their momentum from an aggressive sell-off to aggressive rally in its structure. It is relatively a rare pattern with extreme angles and maybe not easy to recognize until it is mostly formed. The V-Pattern is a powerful reversal pattern seen in all markets, all time-frames and in all instruments. The "V" pattern consists of rapid price action and may not be suited for all casual investors.
The "V" pattern is formed when the trend is sharply reversed from bearish to bullish in case of V-Bottom, or bullish to bearish in case of V-Top patterns.
Trading V-Patterns
The critical aspect of the V pattern is it must have a sharp downtrend followed by a quick and sharp uptrend reversal. Look for one- to three-bar reversals at the bottom of the pattern to signify the sharp reversal process. The volume increases during both the phases of the breakdown (down-shift momentum) and breakout (up-shift momentum). There are a few ways to trade this pattern, but the most conservative way is to trade a long entry once the pattern is complete and retraced back to the neckline (as a pullback). Aggressive traders may enter on the trendline breakouts at the bottom, but the success rate with simple trendline breakouts is low (52%) compared to the neckline breakout (64%) reaching its first target range 62% to 79% of its size from breakout level.
The key factors of the pattern identification.
1. Sharp Downtrend
2. Sharp Uptrend
3. V shaped Pattern (usually 1-3 bars reversals)
4. Volume increase in both breakdown and breakout phases
5. Breakout over neckline
6. Pullback to the Neckline
7. Target
Here is a diagram of the "V" bottom pattern
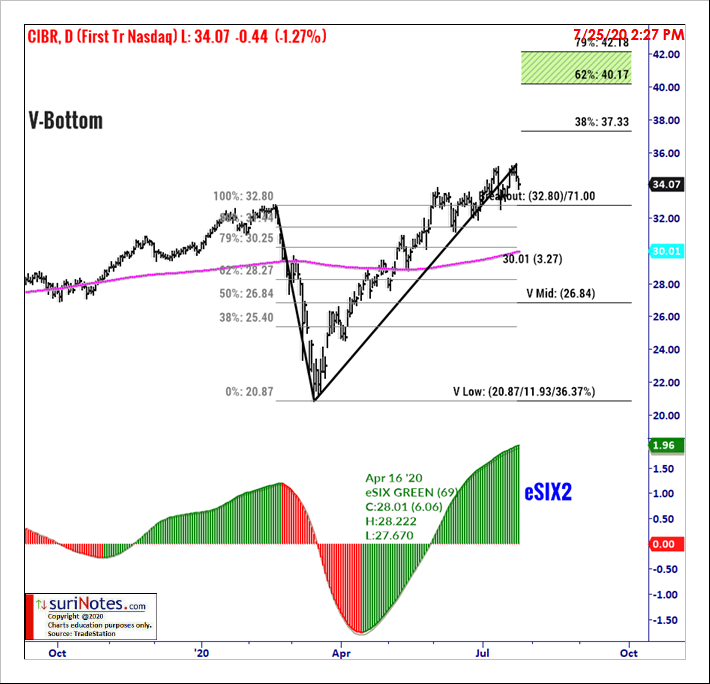
First Trust Cybersecurity ETF V-Bottom Pattern
First Trust Nasdaq Cybersecurity ETF (CIBR) has formed a V-Bottom pattern on its daily chart and is trading above the breakout level of $32.90 (see chart below). V-Bottom patterns are traded when price closes above the breakout level. A stop is placed below the mid-level of the V-Bottom pattern at $26.84. Targets are placed at $40.20, $42.20, $48 and $52.10.
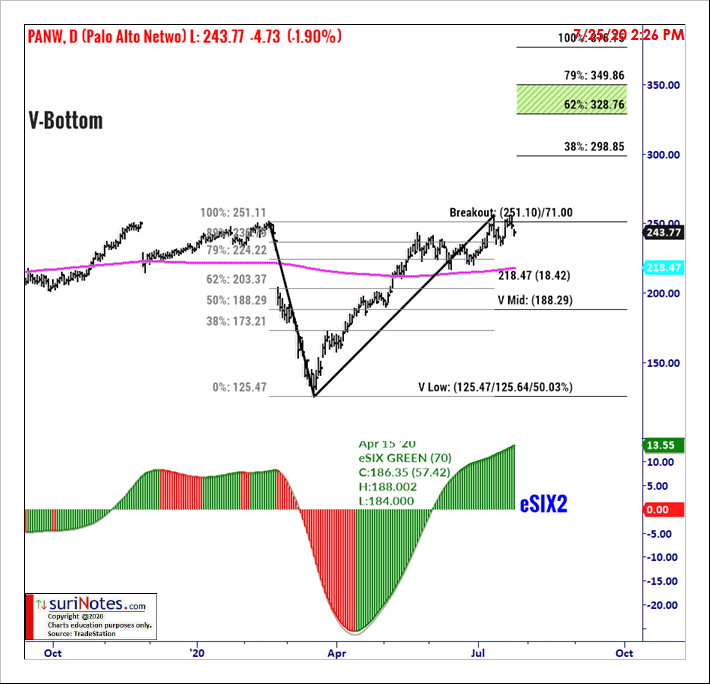
Palo Alto Networks V-Bottom Pattern
Palo Alto Networks Inc. has formed a V-Bottom pattern on its daily chart and trading above the breakout level of $251.21 (see chart below). A stop is placed below the mid-level of the V-Bottom pattern at $188.29. Targets are placed at $328.80, $349.90, $410.70 and $454.60.
These breakouts offer huge potential returns if they hit their targets.
The cybersecurity sector is getting increased attention as one of the results of the Coronavirus pandemic is an outbreak of cybercrime. That is likely to create increased interest in the sector.
Watch Suri’s archived presentation “How to Trade Chart Patterns With Market Context,” from Friday June 12 as part of the New MoneyShow Virtual Event. Find more of Suri’s work at surinotes.com.


