
Suri Duddella highlights technical trading opportunities in 5G-related stocks.
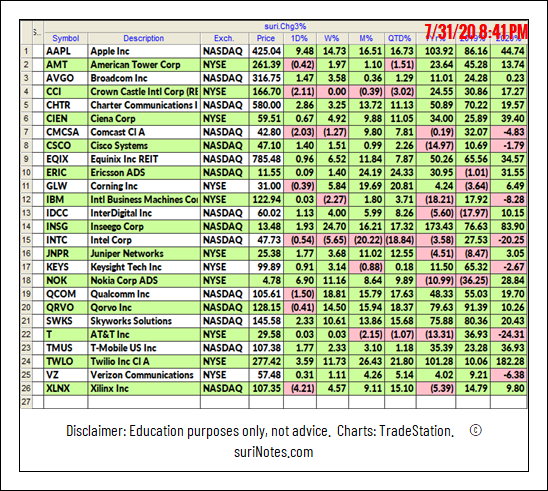
Global 5G smartphone shipments are expected to reach a billion units in 2025, and this could boost the demand 5G networks and 5G-phone stocks. Companies like Apple (AAPL), Broadcom Inc. (AVGO), Qualcom Inc. (QCOM), Skyworks Solutions Inc. (SKWS) are set to benefit from this boost in the coming years.
Here is a list of 5G related stocks and their 2019 and 2020 performances.
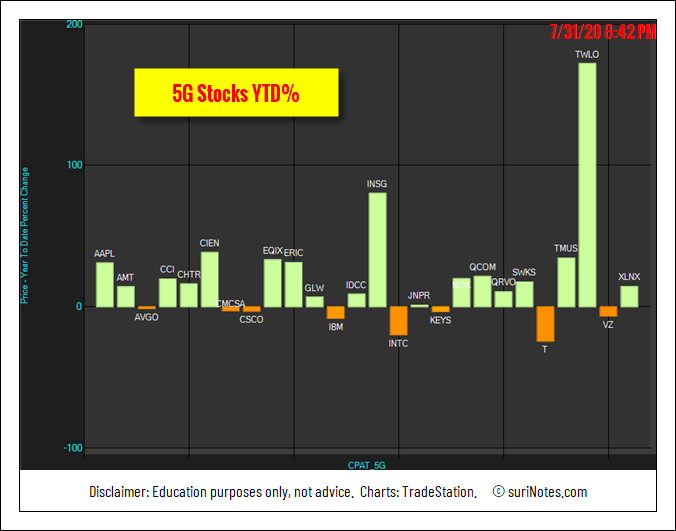
5G related Stocks performance chart in 2020.
Cup & Handle Patterns
The Cup and Handle Chart pattern was developed and popularized by William J. O’Neil in the 1980s through his CANSLIM methodology, Investors’ Business Daily and his book "How to Make Money in Stocks."
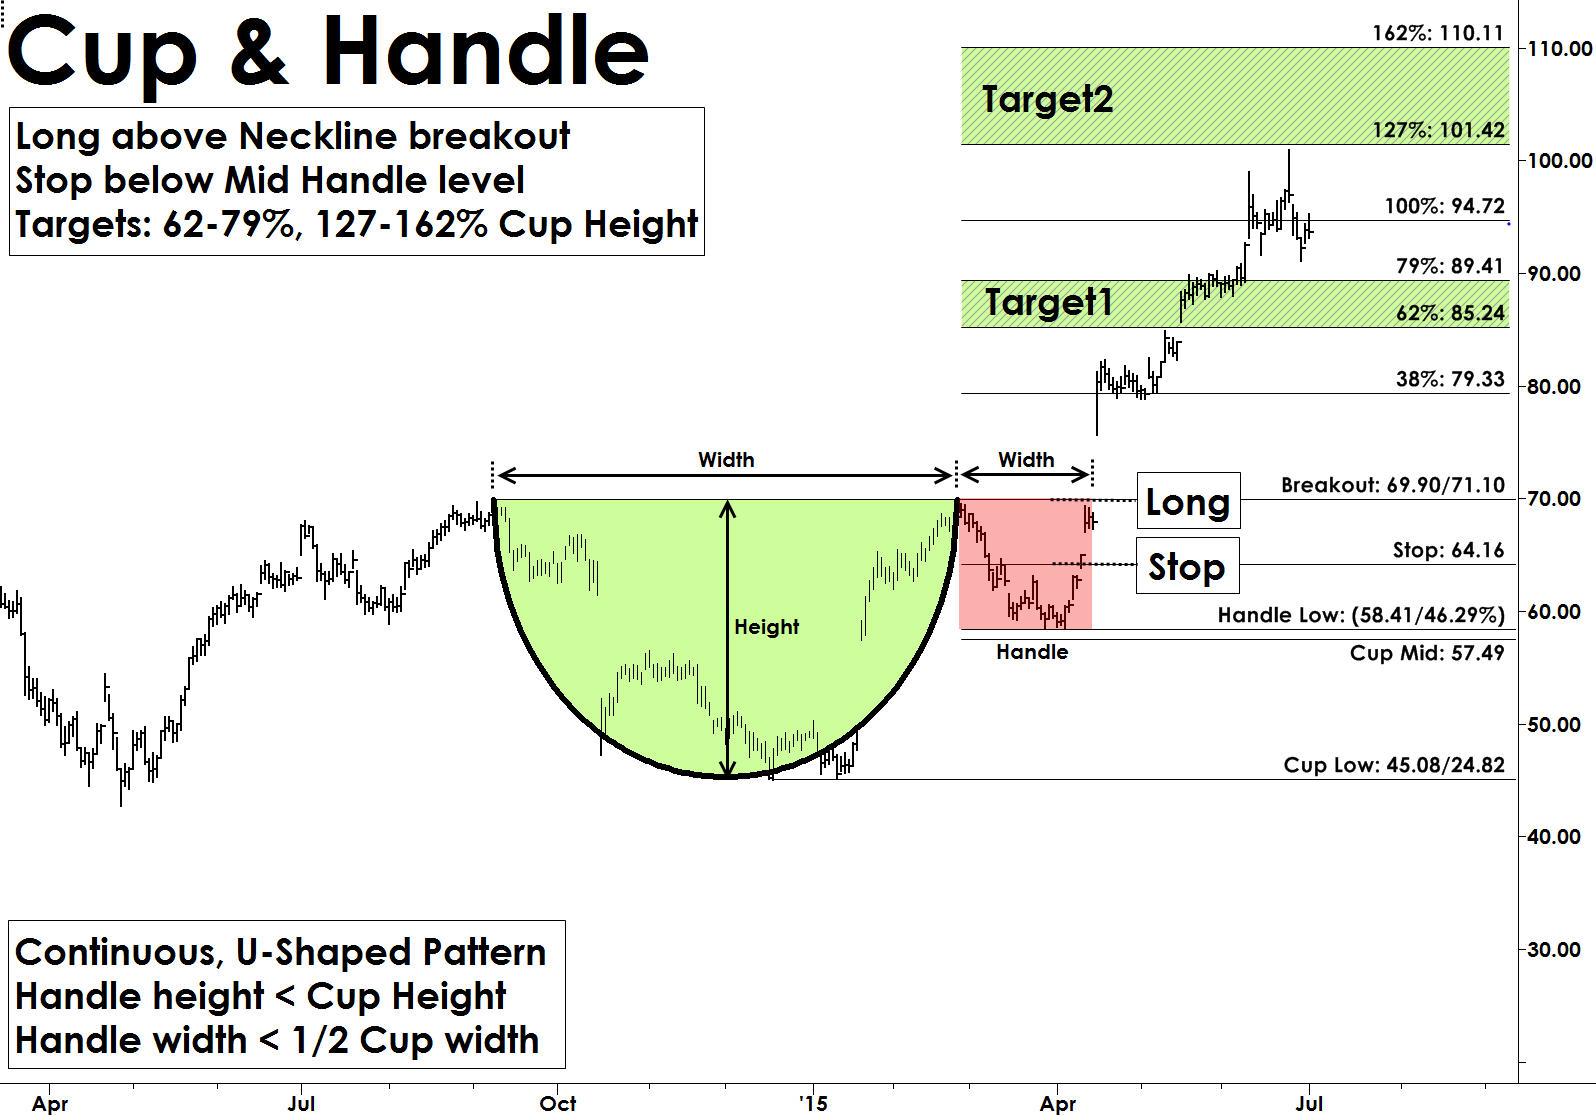
Cup and Handle pattern resembles a Cup with a Handle and are continuation patterns that usually form in bullish trends. Most Cup and Handle patterns are very reliable and offer great trading opportunities. They also form in all markets and in all time-frames. The “Cup” formation is developed as consolidation phase during price rallies from the round bottom formation over multiple weeks to months. The “Handle” part forms due to a price correction after “Cup” formation and before a clear breakout to the upside.
Cup and Handle pattern structure show the momentum pause after reaching a new high in a U-Shape form, followed by another attempt to breakout. When this breakout from the rim of the cup fails it starts to fall back to build the "Handle" structure. Usually, the handle structures are small, and the handle depth should not exceed more than 50% of cup depth. This handle part of the pattern generates interest in buyers as they expect the pattern to breakout from these levels (see chart below). The pattern is valid only if price convincingly breaks out with increased volume above the rim of the cup levels.
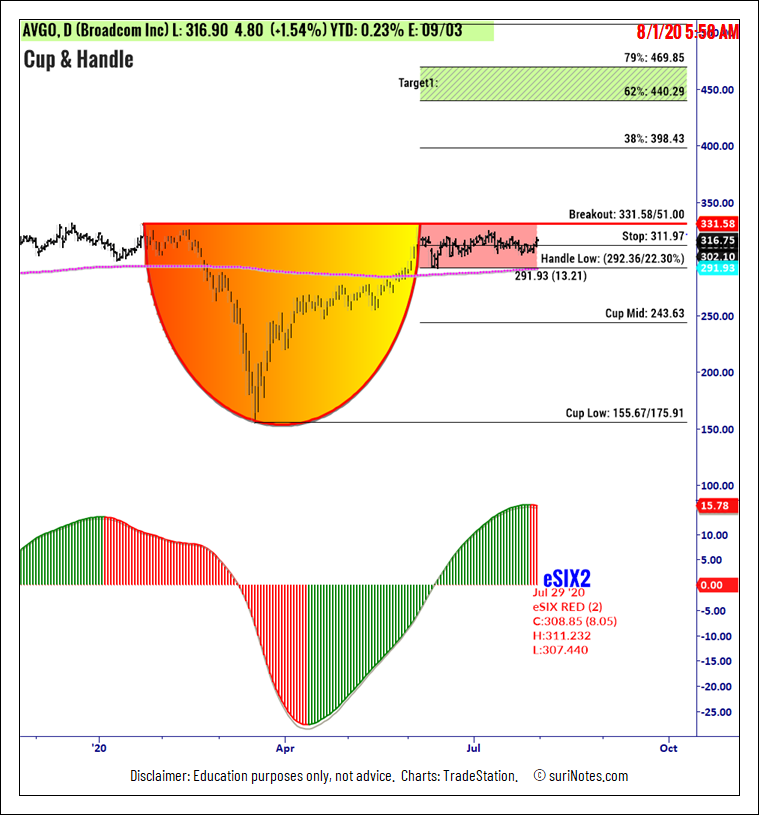
Broadcom Inc. (AVGO) Cup & Handle Pattern
Broadcom Inc. is forming a Cup and Handle pattern on its daily chart and trading near the breakout level of $331.68. Cup and Handle patterns are valid only when price closes above the breakout level. A long trade is entered above the breakout level ($331.68) and a stop is placed below the lowest low of the mid-cup, $243.63, and the handle low, $292.36. Targets are placed at $398.43, $440.30 and $469.80 (see chart).
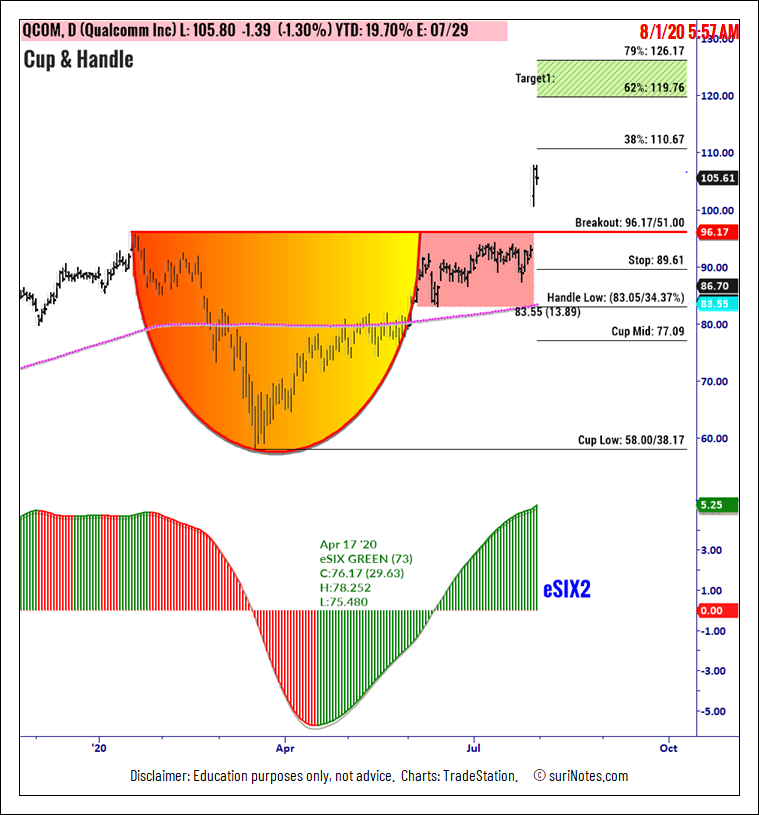
Qualcomm Inc (QCOM) Cup & Handle Pattern
Qualcomm Inc. has formed a Cup and Handle pattern on its daily chart and trading above the breakout level of $96.27. A long trade is entered above the breakout level ($331.68) and a stop is placed below the lowest low of the mid-cup, $77.09, and the handle low, $83.05. Targets are placed at $110.67, $119.80, $126.20 and $134.30 (see chart).
Watch Suri’s archived presentation “How to Trade Chart Patterns With Market Context,” from Friday June 12 as part of the New MoneyShow Virtual Event. Find more of Suri’s work at surinotes.com.


