
Suri Duddella examines promising chart formations in pharmaceutical stocks.
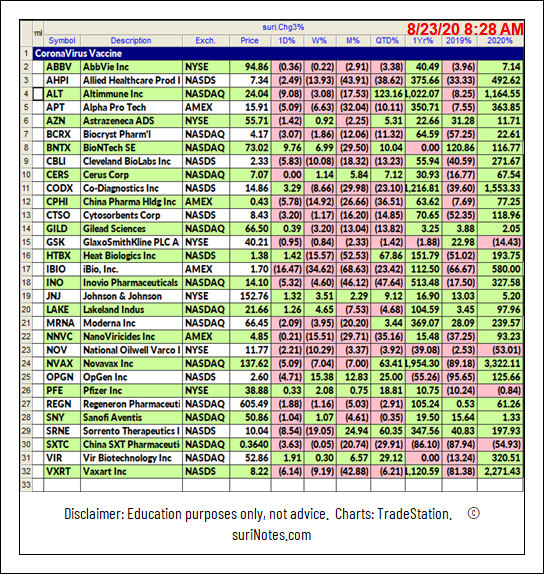
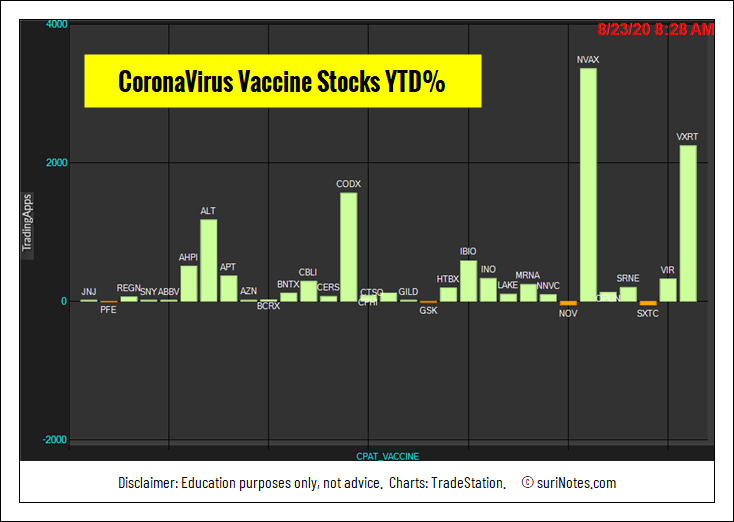
Many pharmaceutical companies around the world are racing to produce a viable vaccine for Coronavirus pandemic. As more than 100 vaccines are in the works, investors are looking for vaccine pharmaceutical company stocks for potential opportunities. Here are the vaccine-related companies and their performances in the year 2020.
Coronavirus Vaccine Stocks YTD% chart
Trading ABC Patterns
The ABC Chart pattern and its related AB=CD Chart Pattern are prime examples of "Symmetry" in the markets. These "Harmonic" patterns help traders to identify buying and selling opportunities in all markets and in all time-frames. The ABC and AB=CD patterns are first described by H.M. Gartley in his 1935 book "Profits in the Stock Market." The main advantages of trading harmonic patterns are that they allow traders to determine risk vs. reward ratios beforehand as they forecast key market turning points and profit targets for traders. The ABC pattern can be a continuous or reversal pattern. It is shaped like a lightning bolt.
Identification
The following chart show ABC Bullish pattern formation and its trade information in TradeStation software.
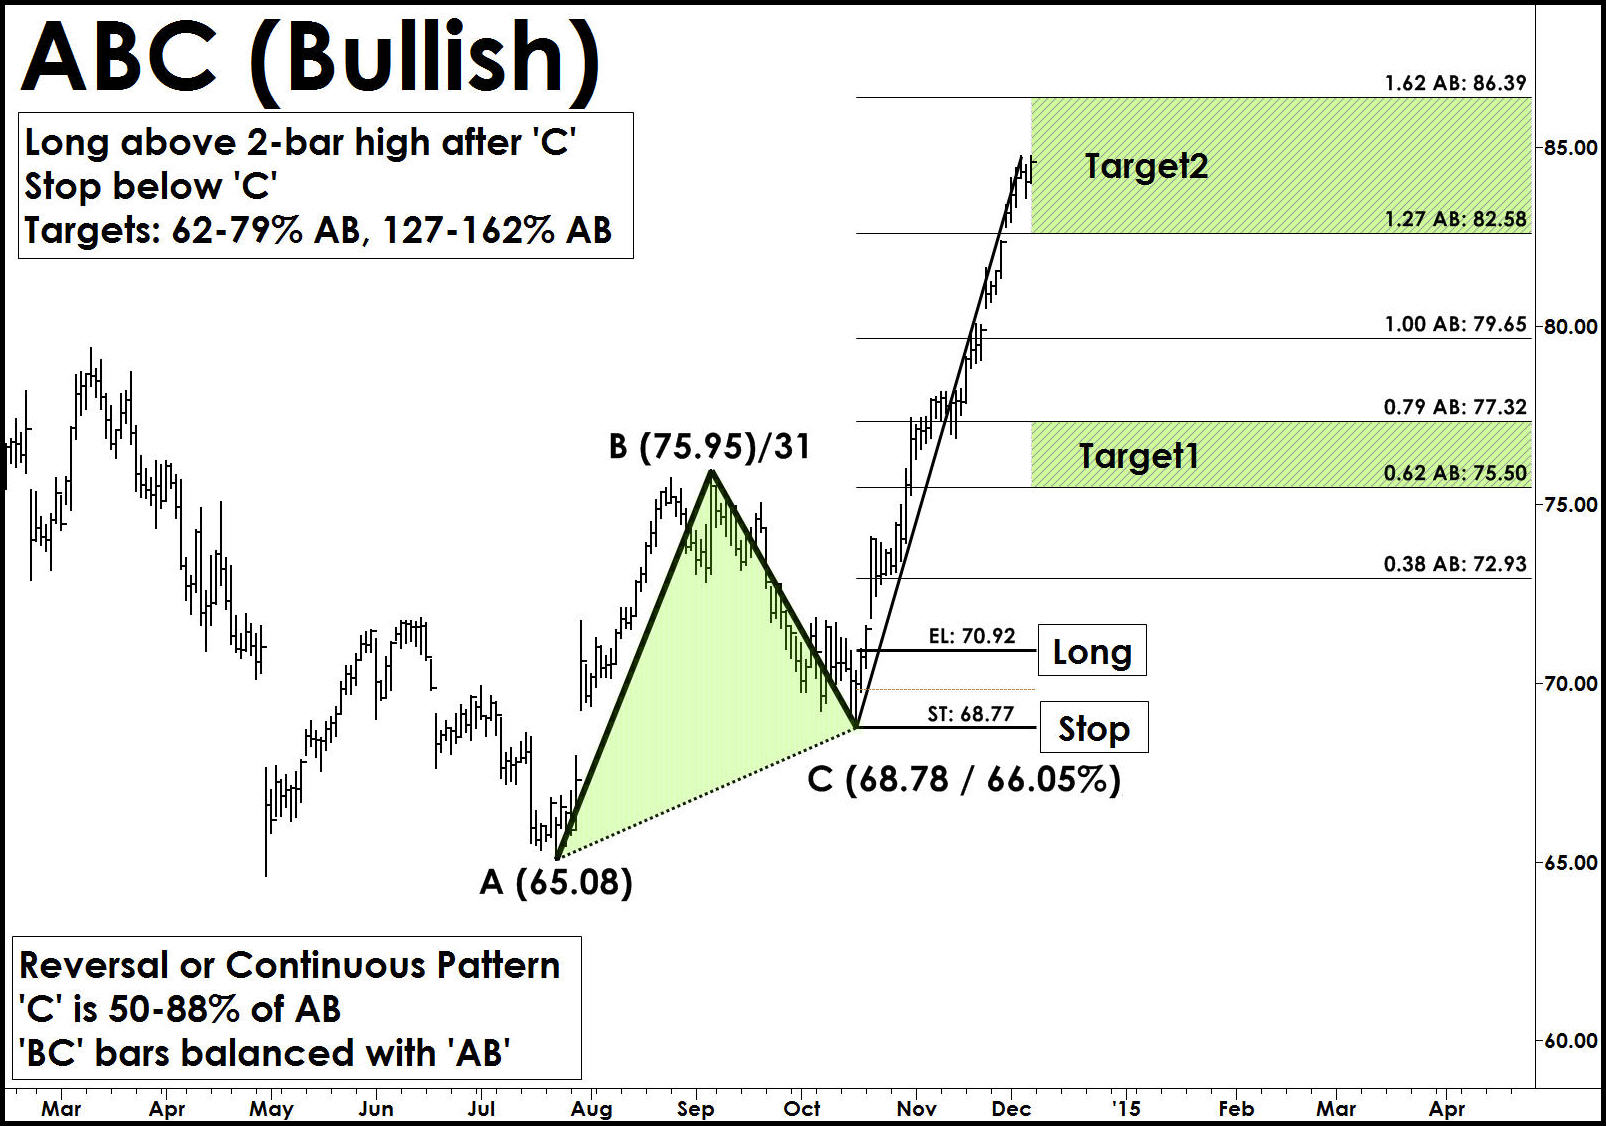
Trade Entry: After the ABC pattern is completed, it is advisable to wait for the pattern to confirm a reversal signal using any momentum based indicator or price confirmation mechanism. Enter after a long trade above the Entry Level (EL).
Stop Loss: A stop is placed few ticks below C (in Bullish) or few ticks above C (in Bearish) levels.
Targets: The ABC Pattern targets are computed using the AB and BC swings. The height pattern (AB) is used to project target levels from C-level using fib. ratios. The first target zone is (62-79% AB) from 'C' and second target zone is (127-162% AB). A secondary target level is set at 100% AB Level.
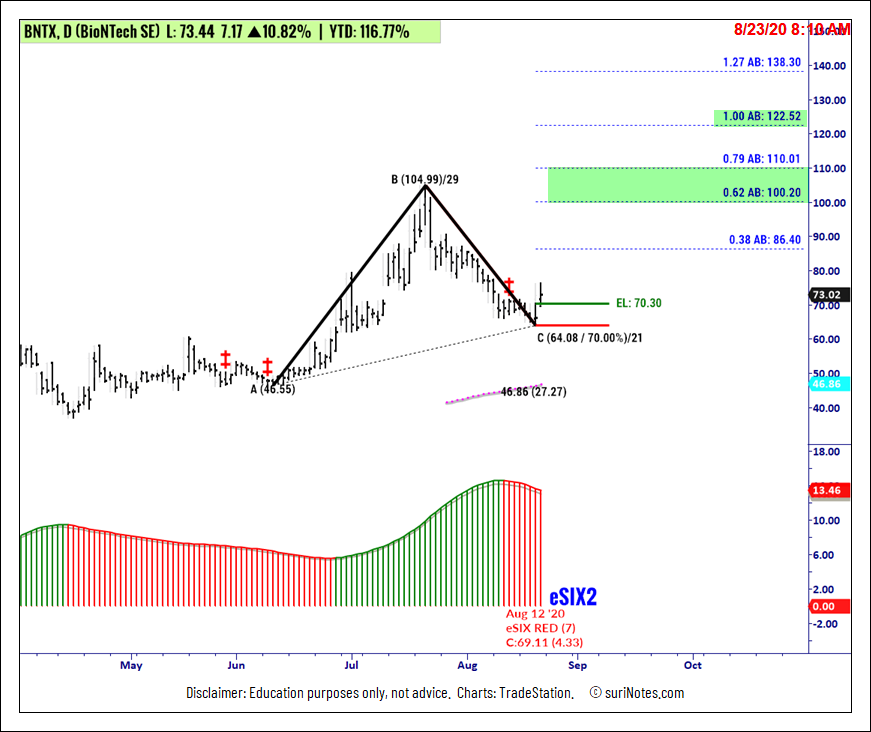
BioNTech (BNTX) ABC Bullish Pattern
BioNTech SE (BNTX) is trading in an ABC Bullish pattern on its daily chart below the long entry level of $70.30 (see chart below). ABC Bullish patterns are valid only when price closes above the entry-level with the confirmed up trend. Enter a long trade above entry-level with a stop below $64.08. Profit targets are $100.20, $110.20 and $122.52.
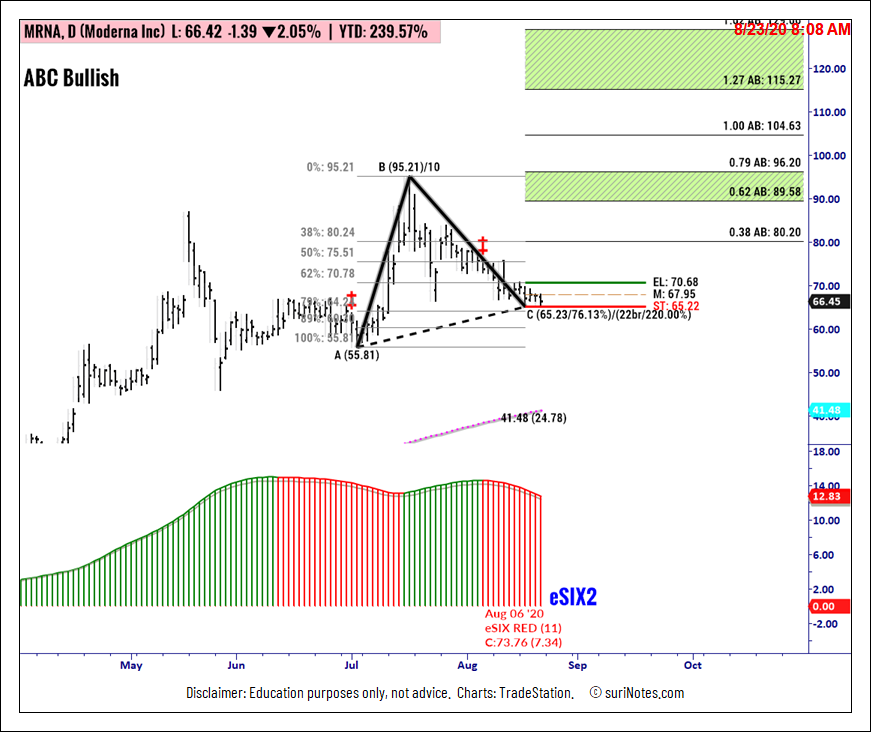
Moderna Inc.
Moderna Inc. (MRNA) is trading in an ABC Bullish pattern on its daily chart below the long entry-level of $70.78 (see chart below). Enter a long above the entry level with a stop below $65.22 (-$5.46). Profit targets are $89.60, $96.20, $115.30 and $129.10.
Watch Suri’s archived presentation “How to Trade Chart Patterns With Market Context,” from Friday June 12 as part of the New MoneyShow Virtual Event. Find more of Suri’s work at surinotes.com.


