
Al Brooks breaks down the technical of last week’s market selloff.
The E-mini S&P 500 futures sold off sharply for two days but bounced on Friday. The bounce might continue to above 3500, but traders expect a second leg down to around 3200.
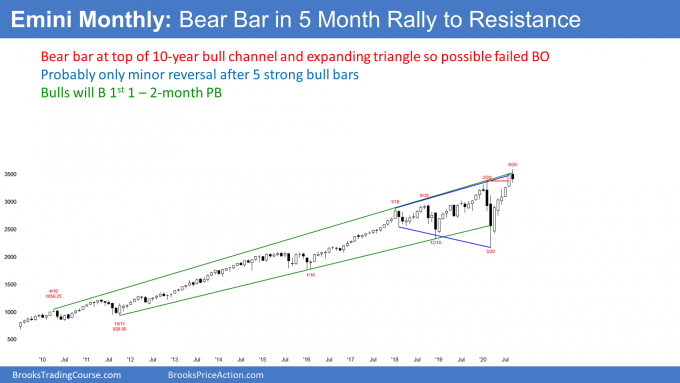
The monthly E-mini S&P 500 futures chart’s price action is similar to that of 2017 (see below). That was the most extreme buy climax in the history of the stock market on the daily, weekly, and monthly charts. At that time, I said it would probably lead to a 10% correction, which it did early in 2018.
I have been saying that traders should expect a 10 – 20% pullback to begin in September. It might have started this week.
September so far is a bear reversal bar on the monthly chart. The bears want the month to have a bear body and for it to close on the low of the month. It might even trade below the August low and form an outside down month. If it has a bear body, it would then be a sell signal bar for next month.
This is still very early in the month. The candlestick could look very different when it closes in four weeks. But given how overbought the monthly chart is, and it being at the resistance of the top of the 3 year expanding triangle, traders should expect a pullback for a month or two.
However, after the dramatic reversal up from the March sell climax, the bulls will buy the pullback. This is true even if it lasts a couple months and the E-mini falls 20%.
What has been happening for 5 months is that the bulls have been resuming that 2017 trend up. They were so exhausted from such an extreme buy climax in 2017 that it took them 2.5 years to begin to buy aggressively again. If often takes a long time for the fundamentals to catch up to price when the price is overextended. Are the fundamentals that good now? The market thinks so whether or not you or I do.
How high can the E-mini go after a pullback?
Will the current trend continue up for a 1,000 point measured move, based on the height of the trading range since early 2018? It might within a couple years, but I don’t think so, and certainly not in a straight line. There probably will be a pullback first before there is a new high. This is because the monthly chart is testing the trend line drawn across the January 2018 and February 2020 highs and because of the extreme buy climaxes on the daily and weekly charts (see below).
Also, I have been saying since 2017 that the E-mini will probably be mostly sideways for a decade. But I have also said that the top of the range could be as high as 4,000.
Why sideways? Because that is what it typically does after a decade-long strong bull trend. Just look at what happened in the 1970’s and after the 2000 tech buy climax. Sideways for a decade. There were new highs in both ranges, but there were also 50% selloffs.
It’s hard to think this way after a huge five-month rally, but that is what is likely. Although the E-mini is at a new all-time high, it is also at the top of a three-year trading range. Traders should expect the trading range to last for many more years, even though traders will probably get at least one more test of the current high after the incipient selloff.
The weekly E-mini futures had a big bull bar last week late in a buy climax (see below). That typically attracts profit-taking, especially when the rally is at resistance. The E-mini is failing at the top of the three-year expanding triangle. This is also the top of the three-year trading range. It is a logical location for bulls to start to take profits.
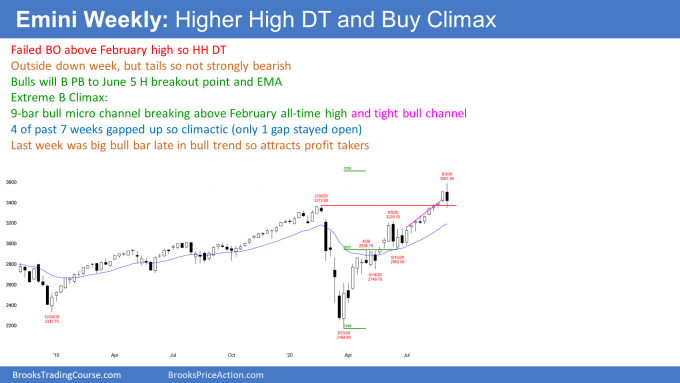
The E-mini traded above last week’s high and then below its low. This week is therefore an outside down bar on the weekly chart. It is therefore a sell signal bar for next week. But is had a big tail below and that makes it a weaker sell signal.
This week also closed the gap below last week’s low. That gap is therefore now a possible exhaustion gap. However, a small gap is rarely very significant, and many other factors are much more important.
It is important to note that the bull trend has not had a pullback since July 3. Every low has been above the low of the prior bar. This is a 10 bar bull micro channel.
All bull micro channels come from aggressive buying. And the bulls will typically buy the 1st 1 – 2 bar pullback. However, when the buy climax is as extreme as this one has been, it sometimes sells off much longer and deeper than what seems likely.
Parabolic wedge buy climax
The 10-week rally has had three surges (small legs up). That makes it a parabolic wedge buy climax, which sometimes leads to a trend reversal and not just a pullback. However, one of two things typically happen. The first common pattern is that there is a sharp selloff lasting 1 – 3 bars (weeks) and then a tight trading range for about 10 bars. At that point, traders decide if the sideways trading is a bull flag or a pause in an early bear trend.
The 2nd pattern is an Endless Pullback. That means the market drifts down with smaller bars, constantly looking like it is forming a bull flag, but every attempt to resume the bull trend fails within a couple bars. This is a Small Pullback Bear Trend. After 10 – 20 bars, there is usually either a breakout up or down. The bulls want a resumption of the bull trend, but the bears want a strong break below the bear channel and then a clear bear trend.
There are many other things that the market can do, but these are the 2 most common after an extreme parabolic wedge at resistance.
How big will a reversal down be?
Regardless of what happens, if this week is the start of profit-taking, traders will look for at least two small legs down over the course of 5 – 10 bars (weeks). They will expect the selloff to test breakout points in the 5 month rally. These include the February high and probably the June 5 high.
If the E-mini falls that far, it might then go sideways for a month or two before traders decide whether the E-mini will test this week’s high or continue down toward the middle of the three-year trading range.
Possible Cup and Handle bottom
The five-month strong reversal up followed a sell climax. There eventually will be a pullback and then an attempt to resume the bull trend.
The sell climax and reversal up form the cup. The pullback then forms the handle. The pullback is a bull flag. The pullback can be brief, like a few bars, or it can last 20 or more bars. That means possibly months.
However, traders should expect an eventual test of the old high, which could be a small breakout above the old high. Then, they will watch to see if the bull trend continues up or if the rally from the handle forms a double top with the top of the cup.
The E-mini daily chart has been in a Small Pullback Bull Trend for three months (see below). I have been saying that a very tight bull channel like this often accelerates up sharply before the profit taking begins. That has been what has been happening for the past couple weeks. Thursday was the start of profit-taking.
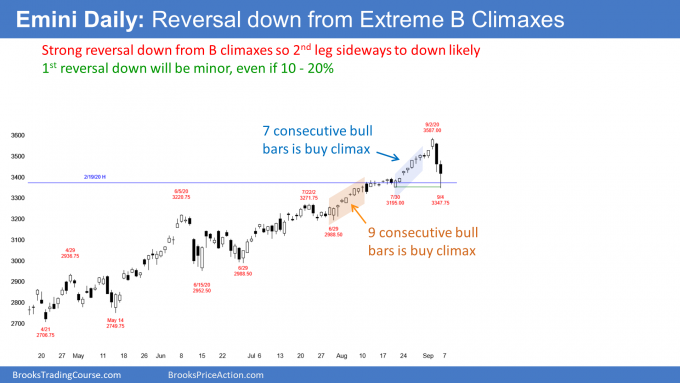
There was follow-through selling on Friday. I have been saying that the E-mini should trade down below the streak of consecutive bull days that ended this week. It fell a few ticks below on Friday and reversed up for the rest of the day.
Bulls want just 1 – 3 day pullback, but more is likely
The bulls hope that the selling will last only a few days and that the bull trend will resume. There is currently a 40% chance that they will get their wish.
There is a 60% chance that the selloff will be deeper and last longer. As a general rule, I look for a TBTL (Ten Bar, Two Leg) pullback after an extreme buy climax. It can be more or less, but that is a reasonable guide. The bulls want to give the bears 2 chances to create a bear trend reversal. If the bears fail twice, the bulls will look to buy again. That is why I say that traders expect at least a couple legs down.
The acceleration up over the past couple weeks created a third leg up from the June 29 low. Three legs up in a tight bull channel is a parabolic wedge. Traders can also see it on the weekly chart. That often soon attracts profit-taking. It is another reason to expect a couple legs down starting this week.
Why is the selling so violent?
There was a strong rally in March, and it has continued for five months with only small pullbacks. Why is the current selloff so big and deep? The March buyers were value buyers. They bought because the E-mini was down 35% and they saw it as a great value. It was cheap. If it fell more, they would buy more. There were buyers below.
The August buyers did not see the market as cheap. They knew that it was expensive. They bought because the momentum up was strong. They knew the odds were that they could make a quick profit. These are momentum bulls.
A momentum bull will not buy more if the market pulls back. They buy, expecting a high probability of a quick profit. They will only allow a small risk since they are going for a small reward. Once they decide that the momentum has stopped, they quickly exit.
That is what happened on Thursday. The momentum bulls who bought in August panicked out of their longs.
The E-mini probably has not fallen enough for value bulls to eagerly buy. So, who is left to buy? Probably no one at this price and time. Therefore, the E-mini will likely have to fall more to attract buyers.
Streaks of 9 and 7 consecutive bull bars
I talked about the streak of nine consecutive bull bars that ended on Aug. 11. There was another streak of seven consecutive bull bars that ended on Aug. 31. I mentioned above that the E-mini on Friday reversed up from below the bottom of the seven-day streak. It will probably go lower.
The most recent prior streak of 8 or more bars was in June. Five days later, the E-mini fell 8% to below the bottom of the streak.
The last streak of nine bars ended Jan. 16, 2018. The rally had two more legs up over the next two weeks, and then the E-mini sold off 10% to far below the bottom of the streak.
With streaks of 9 and 7 consecutive bull bars over the past month, traders should expect a reversal down to below the bottom of one or both streaks. The seven-bar streak began around 3,350 and the bottom of the nine-bar streak was 3,195. A pullback to 3,200 would be a 10% selloff from the high.
There is a 50% chance that the selloff will continue down to below the bottom of the tight bull channel, which is around 3,000. That would be about a 20% correction. That is why I have been saying that the eventual reversal down will probably be at least 10% and possibly 20%.
What about this week?
The E-mini was very overbought on the daily and weekly charts prior to Thursday’s dramatic reversal down. What happens over the next few days will give traders an idea of what to expect over the next couple weeks.
If the E-mini quickly resumes up, then traders will expect a new high. More likely, the E-mini will have at least a small 2nd leg down after an extremely big Bear Surprise Bar whether or not it tests above 3500 early next week.
As I have been saying for several weeks, the E-mini will probably have to fall between 10 – 20% before the bulls will look to buy again. Furthermore, if it falls that much, it might have to go sideways for many weeks before traders are convinced that the selling has ended.
Trading Room
Traders can see the end of the day bar-by-bar price action report by signing up for free at BrooksPriceAction.com. I talk about the detailed E-mini price action real-time throughout the day in the BrooksPriceAction.com trading room. We offer a two-day free trial.


