When it comes to forex trading, nearly all traders look for some kind of indicator in order to determine the future possible direction of the currency pair, explains Konstantin Rabin.
It goes without saying that there is no single forex indicator, which can always guarantee success. Instead, every trader might have his or her own preferences on the subject.
However, here we will focus on five easy-to-understand simple indicators that traders can make use of in their daily trading. Firstly, we have moving averages. It essentially measures the average exchange rate during the last specific number of days and is displayed in the chart as a separate line.
Some traders also use the so-called "Heiken Ashi" charts. This is because those types of charts tend to make the process of trend detection much easier, compared to some other more conventional charts. Consequently, it can be a very handy tool for market participants.
The Consumer Price Index, also known as CPI, is a very important economic indicator in forex trading. It measures the annual changes in the price levels. Due to the fact that the majority of the central banks in the world have some specific target for CPI, this measure tends to have a notable impact on the currency markets.
Another important indicator in the forex market is the relative real interest rates. This essentially determines how the given currency retains its purchasing power on the bank deposits. It is not surprising that everything else being equal, higher interest rates tend to support the exchange rate of the currency in question.
The purchasing power parity, also known as the PPP is one of the most important long-term fundamental indicators. It basically represents an exchange rate at which the average price of goods and services between the two countries can be equalized. According to the PPP theory, the long-term exchange rates tend to gravitate towards this level.
Moving Averages
When it comes to forex analysis, it is worth noting that there are two categories of indicators. There are so-called technical indicators, which essentially come from the chart analysis. There are also fundamental indicators, which include different types of economic measures.
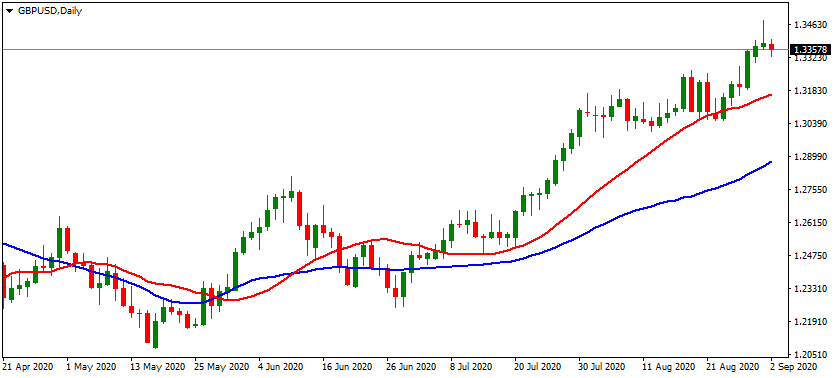
One of the most common and well-known technical indicators is the moving averages. The moving average essentially measures the average exchange rate during the specified number of periods. In order to illustrate this better, let us take a look at this daily GBP/USD candlestick chart:

As we can see from the chart above, the GBP/USD pair has been in an upward trend since the middle of May 2020, rising from $1.21 to well above $1.33 level. In this chart, the red line represents the 20-day standard moving average, also known as the 20-day SMA. This shows the average market closing exchange rate over the last 20 days of trading. The main principle here is very simple. As the market closes for the additional day, the older data is discarded and a new one is included in the SMA.
In general, a 20-day simple moving average is generally regarded as an important short-term technical indicator. This tool has several uses. Firstly, as we can see in the above diagram, it shows us the latest market trends with a given currency pair. This can be very helpful when used in conjunction with the trend following strategies.
In addition to that, the moving average indicators can also be used to detect potential reversals. The fact of the matter is that many experienced forex traders consider the pair to be in a downward trend when the exchange rate is below the simple moving average line. However, if the market rate manages to break above the SMA line, then many market participants take this to be a sign of the reversal.
The same is true for the opposite scenario. If the pair is an upward trend, but at some point, the market exchange rate breaks below the SMA line, then this can be a major bearish sign and it might point to a major reversal.
Obviously, the 20-day simple moving average is not the only type of indicator in this category. In addition to that on the above chart, we have a 50-day SMA, displayed by the blue line. This is generally considered to be an important medium-term indicator. Finally, many professional forex traders also make use of the 200-day simple moving average in the long-term analysis.
Besides the simple moving average indicator, we also have an exponential moving average, also known as EMA. Those two measures are quite similar. However, the main difference between those two is the fact that the exponential moving average gives greater weight to the latest market closing prices, compared to the earlier ones. Here it is worth noting that there is no standard rule, which moving average indicator traders should use. Instead, this all depends on the individual’s preferences and trading style.
Heiken Ashi Chart
In addition to using a moving average, some market participants prefer to use the so-called "Heiken Ashi" charts. Those types of diagrams have been invented in Japan. The methodology behind those charts makes it visually much easier to detect the latest market trends and reversals, compared to other more conventional candlestick or line charts.
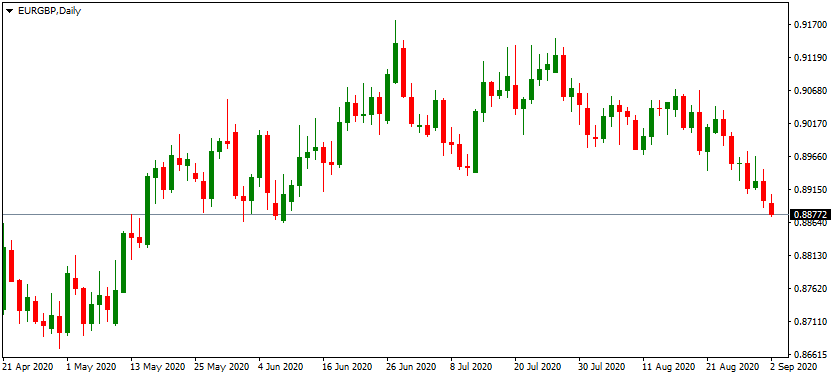
In order to illustrate the differences better, let us take a look at this traditional candlestick daily EUR/GBP chart:

As we can see from the above diagram, we have very contradictory signals with those candlesticks. One can guess that the pair was generally in an upward trend most of the time until it started declining during late July 2020. However, for the sake of fairness, it is worth noting that this chart can confuse many traders since the signals here seem quite unclear.
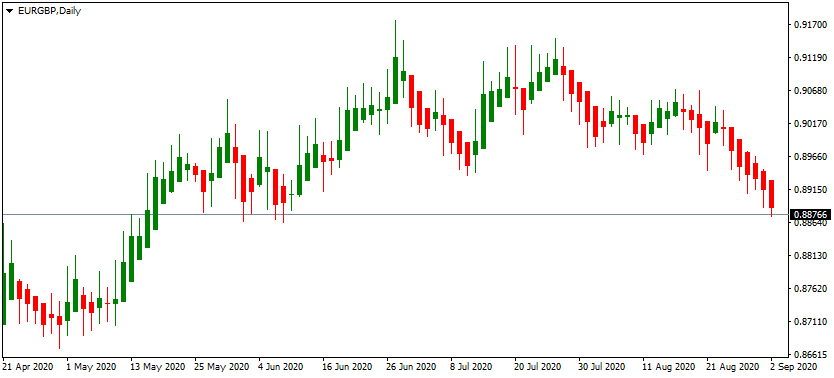
Now, let us compare this chart to one below, which is a Heiken Ashi diagram for the same pair, covering the same period:

So, as we can see from the above image, the use of the Heiken Ashi chart has cleared a lot of confusion. We can now clearly see that the EUR/GBP pair was in an upward trend from May 2020 until the end of June. However, at this point, the market started moving sideways, with the pair remaining relatively flat until the middle of August. Finally, we can notice that a new downward trend emerged before the end of the month. This downtrend is still in an effect.
Therefore, after this analysis, one might conclude that at this stage it might not be the best idea to buy the EUR/GBP pair. It might be much wiser to sell the pair or at least wait on the sidelines for a better entry point in the market.
So, as we can see from this example, the Heiken Ashi charts can provide traders with visual aids so that they can identify the latest trends and reversals, without spending hours on technical analysis. Therefore, it can be a very handy tool for beginners as well.
Consumer Price Index
It goes without saying that the technical indicators are not the only ones used in the currency analysis. In fact, there are several fundamental measurements that can certainly help traders to improve their trading.
One of those indicators is the so-called Consumer Price Index, also known as CPI. This is essentially one of the most famous measures of inflation in a given economy. At this point, some people might wonder why this indicator has a significant influence on the exchange rates?
Well, in order to answer this question, it is essential to remember that the majority of the central banks in the world have a mandate of price stability. Now, the fact of the matter is that they do have some specific target for the annual inflation rate. Despite the implication of the name, the policymakers do not define the price stability as consistently achieving the 0% inflation rate. Instead, they aim for higher inflation.
For example, 2% is a very popular target among the central banks, however, there are some other options as well. The 2% inflation target is adopted by the US Federal Reserve, as well as the Bank of England in the UK. At the same time, the European Central Bank aims to keep the inflation below but close to 2%.
Now, here it is worth mentioning that the inflation target does not always have to be a specific number. In fact, it can be represented by a specific range. For example, the Reserve Bank of New Zealand aims to keep inflation within a 1% to 3% range. So, obviously this makes inflation targeting more flexible and consequently, relatively easier to achieve.
Consequently, when the CPI rate diverges from its intended target to a considerable extent, then it is highly likely that the central bank might respond by the changes in the monetary policy. This means that if the inflation rate drops well below the aim, then the policymakers might decide to cut the interest rates or even resort to quantitative easing. This in turn makes the currency less attractive.
This is because, with lower interest rates, savers will earn smaller returns on their bank savings accounts and the certificates of deposit (CDs). In addition to that, it becomes less attractive to traders as well since with this currency they can earn lower returns with carry trades. Consequently, it is not surprising that the interest rate cuts tend to weaken the currency in question.
The opposite is also true. If the inflation rate goes well above its intended target, then at some point in the future, the policymakers at the central bank might decide to increase the interest rate. This makes the currency more attractive to traders, savers, and investors. Consequently, the interest rate hikes tend to strengthen the exchange rates of the currency.
Now, the reality of the matter is that the forex market usually just assumes that the central bank will do the right thing. Therefore, if the CPI rate rises considerably above its intended target, the market will then predict that the policymakers will eventually raise rates. As a result, the currency in question will already start appreciating against its peers.
At the same time, if the inflation rate of a given currency drops below its target, close to or below zero, then the market might assume that an interest rate cut is coming and consequently, will likely start selling the currency.
Consequently, the Consumer Price Index releases can give the market participants early clues about the future exchange rate movements. It is easy to understand and utilize and therefore can be a very helpful indicator for forex traders.
Relative Real Interest Rates
As we have seen before the nominal interest rates, the ones set and announced by the central banks do play a major role in the exchange rate dynamics. However, the fact of the matter is that there are many professional forex traders who believe that the real interest rates are even more important in the market than the nominal ones.
The main difference between those two terms is that the real interest rates take the inflation rate into the account. For example, if a given central bank sets rates at 3% and the CPI is running at 2%, then the real interest rate will be at 1%.
As the financial expert and chief investment officer of the Merkfunds, Axel Merk mentioned, the market experience has shown us that very often it is the real interest rates that drive the exchange rates rather than the nominal rates.
This makes a lot of sense since in general people are more interested in what they could buy with their money, rather than the nominal amount of the currency. This theory also explains the fact why some emerging market currencies, which have higher rates, still often tend to depreciate against the major currencies.
One example of this would be the USD/TRY currency pair. It is worth remembering that since March 2020, the US Federal Reserve kept its Federal Funds Rate within 0% to 0.25% range. At the same time, the Turkish central bank has its own interest rates at 8.25%.
Now, if we confine our analysis only to nominal rates, then it will appear that this should have given a massive advantage to the Turkish lira and consequently, nowadays it should be making some serious gains against the US dollar.
Despite those expectations, actually we are dealing with quite the opposite. A year ago, the USD/TRY pair was trading close to 5.75 level and after 12 months of trading has reached the 7.40 level. This means that in just one year, the US dollar has gained 28.7% against the Turkish currency.
At this point, the obvious question is: how is it possible for the USD to be appreciating significantly against the TRY when the nominal interest rates in Turkey are 8% higher than in the US?
Well, to respond to this question, we need to take a look at the real interest rates. According to the latest CPI release, the annual US inflation rate stood at 1% during July 2020. This means that if depositors open a certificate of deposit at 0.25% for a year, then will gain 0.25% in nominal terms, but might lose 1% to inflation. So, the net loss here will be -0.75%. Therefore, the real interest rates in the US are near -0.75%.
Now, this might not be very attractive to savers and investors, but the situation with the Turkish lira is even worse. According to the latest CPI publication, the annual inflation in the country stands at 11.8%. This suggests that the real interest rates in Turkey currently are at -3.55%. Therefore, surprisingly, the real interest rates in the US are 2.8% higher than in Turkey.
The main reason why this indicator matters is because savers and investors do care about the purchasing power of their capital. So even if the currency has a high nominal interest rate, if the real rates are deep into the negative territory, then it is not attractive for the most market participants.
Finally, it is worth noting that even if at some point the real rates in Turkey become positive due to falling rates of inflation or central bank rate hikes, it might not guarantee an appreciation of TRY. The fact of the matter is that investors look not only on the latest headline numbers but also long-term average figures as well.
The US dollar is the world’s reserve currency, which has a track record of the long-term average inflation rate of 3%, something which is not the case with not only the Turkish lira but also with other currencies of developing countries. Consequently, in order for the USD/TRY uptrend to end, the lira has to have a significant advantage in terms of real interest rates over the US dollar, in order to make it more attractive for the market participants.
Purchasing Power Parity
Another important indicator in the forex market is the purchasing power parity, also known as PPP. This measure essentially represents an exchange rate at which the average prices of goods and services will be equalized between two given countries. The PPP theory itself suggests that the market exchange rates tend to gravitate towards this level.
The reasoning behind this is quite simple. If the average prices of products in one nation is cheaper than the other, then its exports will be more competitive and attractive for foreign importers. In order for those individuals to access those goods and services, they have to convert their currencies into the local currency. As a consequence, the local currency will appreciate against its peers, until they reach the PPP level and thus the equilibrium will be restored.
Here it is worth noting that there is no single universally accepted measure of PPP. Instead, this indicator is calculated and published by several organizations. For example, the Organization for Economic Cooperation and Development, also known as the OECD, publishes and updates the latest PPP rates for major currencies on an annual basis. Also, the British financial journal, The Economist, also calculates PPP with its so-called "Big Mac Index" and publishes it on its website typically twice per year.
For example, in June 2008, the GBP/USD market exchange rate was near the 2.00 level. According to The Economist, the purchasing power parity level for this pair was at 1.57. In other words, if the exchange rate returned to 1.57, then the average prices between the goods and services of those two countries would be equalized. Sure enough, from August 2008, the GBP/USD pair dropped sharply, eventually going all the way down to 1.40 mark, before stabilizing near 1.60 level, during July 2009.
Now, despite all of its usefulness, it is important to mention that the purchasing power parity is a long-term indicator. It is worth keeping in mind that in some cases it might take several months or even some years for the market to restore the balance between two currencies. Consequently, the PPP indicator is mostly suited to be used in conjunction with long-term strategies. Therefore, it might not be very useful for scalping or day trading.
In addition to that, it is worth pointing out that just like with any other forex technical or fundamental indicator, it might be a very useful idea to combine PPP analysis with other indicators. This is because making trading decisions solely based on one particular indicator can be misleading and potentially lead to some losses.
The fact of the matter is that some currencies do remain undervalued or overvalued for an extended period of time. The reasons for this can be several. Currencies might trade below the PPP level, due to very low interest rates, political instability in the country, large amounts of budget or trade deficits, or any other reasons. Therefore, it is helpful to check other fundamental and technical indicators as well, when making trading decisions in the forex market.
By Konstantin Rabin of TopForexBrokers.net - broker comparison site


