
Option calculations help guide us to an accurate assessment of our covered-call-writing profits. It’s more meaningful to use percentages rather than dollar amounts when executing these calculations, explains Alan Ellman of The Blue Collar Investor.
For example, a $1,000.00 profit on a $10,000.00 investment (10%) is much more significant than a $1,000.00 return on a $100,000.00 investment (1%). That’s why percentages form the foundation for both versions of the Ellman Calculator (BasicElite). Our most recent spreadsheet, the Elite-Plus Calculator offers both dollar and percentile returns for each position, as well as the entire portfolio.
Last year, one of our members shared with me one of his successful covered-call-writing trades and inquired about percentage returns month-to-month. In this article, I will break down that trade and use the Ellman Calculator to demonstrate the second leg of the trade, which included rolling out-and-up.
The Trade with Allergan (AGN)
- 5/28/2019: Buy 100 x AGN @ $121.19
- 5/28/2019: Sell 1 x May 31 Weekly $120.00 call at $3.52
- 5/31/2019: Share value: $125.59
- 5/31/2019: Buy back May 31 $120.00 call at $6.20
- 5/31/2019: Roll out-and-up to the June 21 $125.00 call at $4.10
- 6/21/2019: Option expires in-the-money and shares are sold for $125.00
Initial Calculations with the Ellman Calculator
You will note that the trade was established at the end of May with a Weekly contract. Here are the final returns from the first four days of the trade as shown in the multiple tabs of the Ellman Calculator:
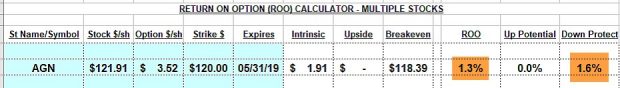
AGN: Weekly Contract Returns with the Ellman Calculator
A very significant short-term return (1.3% in four days). Note that the intrinsic-value component of the premium ($1.91) is not used as part of our initial time-value profit but rather to “buy-down our cost-basis to $120.00. This computation allows us to make the best trading decision at that point in time. Next, a decision was made to roll-out (next month) and up (higher strike price). For this computation we use the “what now tab” of the Ellman Calculator and first fill in the blue cells on the left side of the spreadsheet:
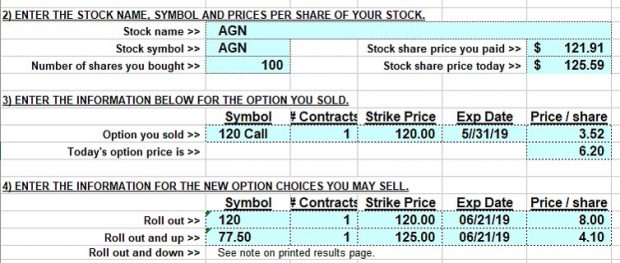
AGN: Roll Option Entry Information
Calculating Rolling Out and Up Returns
The option was bought back at $6.20 and the next month’s higher strike was sold for $4.10. The key point here is that our cost basis is now $120.00, not $120.36 or $125.59. The reason is that we are deciding whether to roll the option or allow assignment. We must compare “apples-to-apples” If we permit assignment, we will receive $120.00/share as per our initial option obligation. If we roll the option, our cost basis must be the same so we can decide which approach is in our best interest. Once the blue cells on the left side of this tab are filled in as shown above, the white cells on the right side become populated with results: Once the shares were sold as a result of option exercise on 3/21/14, a 2.42%, one-month return was realized and Jon had $12,500/contract in cash to use the following week for the April contracts.
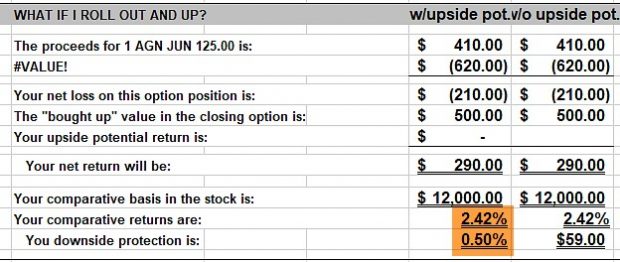
Rolling Out-And-Up with AGN
This second set of calculations also represents a way of making the best trading decision at that point in time.
Final Returns
In reality, this is a six-week return because the trade was initiated mid-contract in February:
We will now view this series of trades in totality:
- Stock side: ($125.00 – $121.19) = + $3.81
- Option side: (+$3.52 – $6.20 + $4.10) + $1.42
- Net gain = $3.81 + $1.42 = +$5.23
- Six-week % return = $5.23/$121.19 = 4.3%
Summary
Although calculations can be challenging for many of us, using percentages and the Ellman Calculator will make our covered-call-writing decisions more meaningful and help elevate our returns to the highest possible levels. Calculations can focus in on specific trades at any given point in time or on total returns for a series of trades.
Learn more about Alan Ellman on the Blue Collar Investor Website.


