
In 2020, the Coronavirus pandemic accelerated e-commernce and digital payments as people favored contact-less digital payments, states Suri Duddella of suriNotes.com.
Investors are seeking investment opportunities in digital payment companies like Paypal, Square, Shopify, Mastercard, or Visa as they show promise of increased growth.
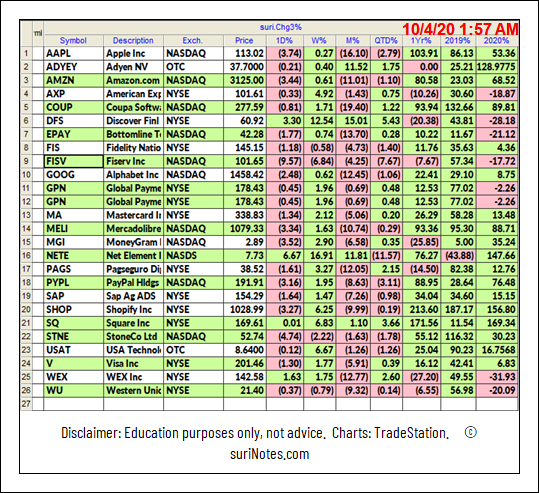
Digital Payment companies include companies from e-commerce, payment networks, money transfers, personal finance, and banking sectors.
List of Digital Payments and Digital Technology companies:
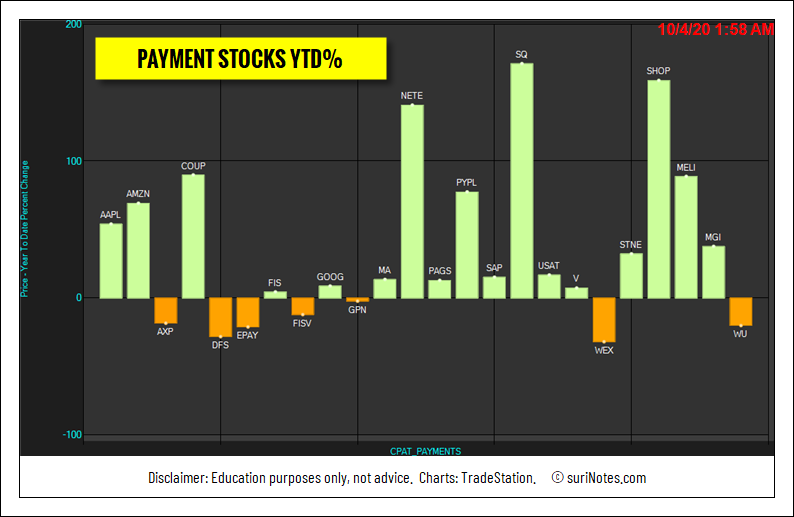
Payments Stocks Year-to-Date Performances:
V Patterns
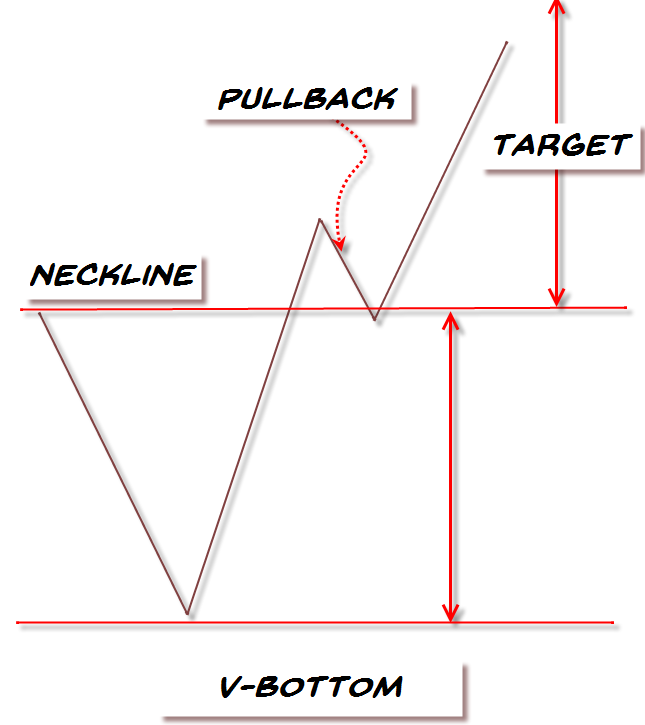
As the name implies, the "V" chart patterns have the letter "V" shape and prices shift their momentum from an aggressive sell-off to aggressive rally in its structure. It is relatively a rare pattern with extreme angles and maybe not easy to recognize until it is mostly formed, which is why we do not attempt to predict the initial reversal. The V-Pattern is a powerful reversal pattern seen in all markets, all timeframes, and in all instruments. The "V" pattern consists of rapid price action and may not be suited for all casual investors. The "V" patterns are formed when its trend is sharply switched from bearish to bullish (in case of V-Bottom) or bullish (or sideways) to bearish (in case of V-Top patterns).
Trading V-Patterns
The critical aspect of the V pattern is it must have a sharp downtrend followed by a quick and sharp uptrend reversal. Look for a 1-3 bar reversals at the bottom of the pattern to signify the sharp reversal process. The volume increases during both the phases of the breakdown (down-shift momentum) and breakout (up-shift momentum). There are a few ways to trade this pattern, but the most conservative way is to trade a long entry once the pattern is complete and retraced back to the neckline (as a pullback). Aggressive traders may enter on the trendline breakouts at the bottom, but the success rate with simple trendline breakouts is low (52%) compared to the neckline breakout (64%) reaching its first target range 62% of its size from breakout level (see chart).
The key factors of the pattern identification:
1. Sharp Downtrend
2. Sharp Uptrend
3. V Shaped Pattern (usually 1-3 bars reversals)
4. Volume Increase in Both Breakdown and Breakout Phases
5. Breakout over Neckline
6. Pullback to the Neckline
7. Target
Here is a diagram of the "V" bottom pattern
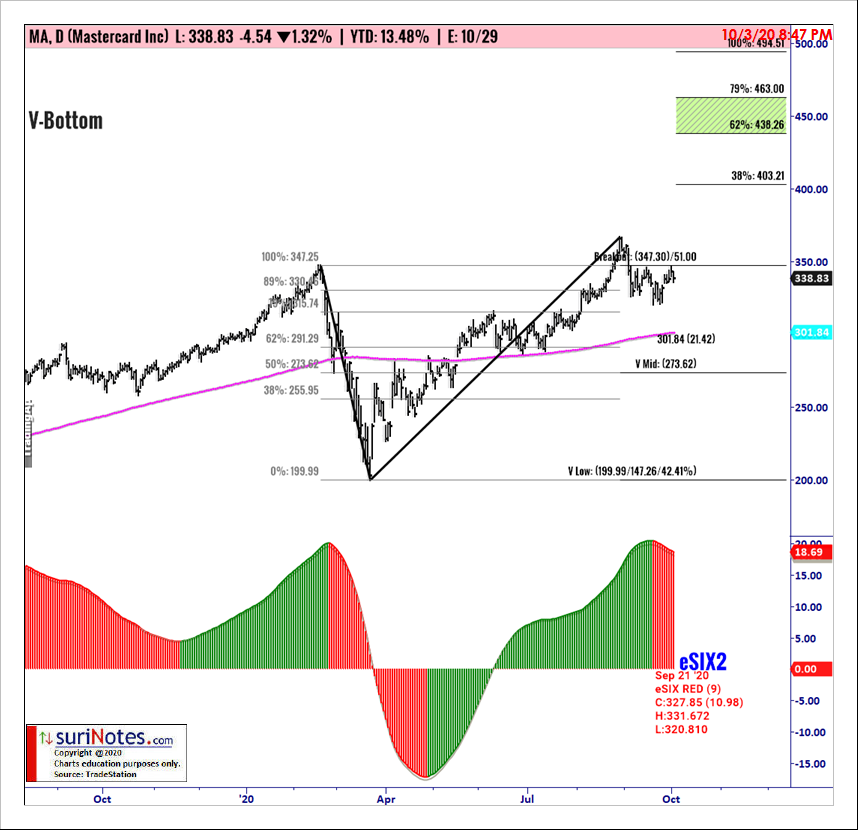
Mastercard V-Bottom pattern
Mastercard Inc. (MA) is forming a V-Bottom pattern on its daily chart and trading near the breakout level of $347.35. V-Bottom patterns are traded when price closes above the breakout level. A stop is placed below the mid-level of the V-Bottom pattern at $273.62 or the recent pivot low. Targets are placed at $438.3 to $463.0.
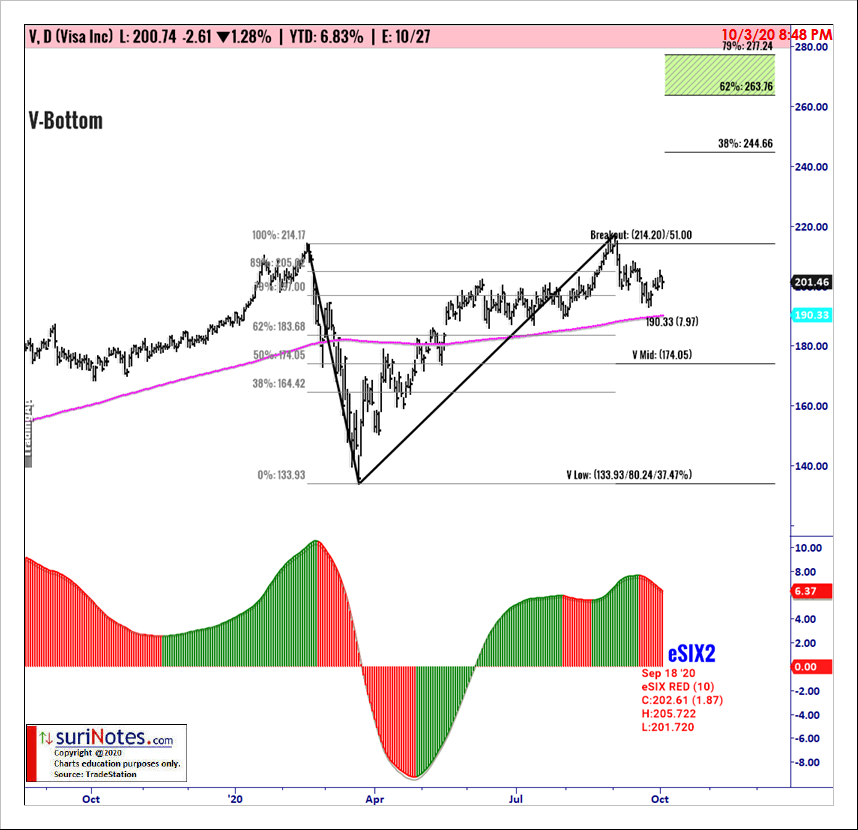
Visa Inc., V-Bottom Pattern
Visa Inc. (V) is forming a V-Bottom pattern on its daily chart and trading below the breakout level of $214.27. V-Bottom patterns are traded when price closes above the breakout level. A stop is placed below the mid-level of the V-Bottom pattern at $174.05 or the recent pivot low. Targets are placed at $263.8 to $277.2.
To learn more about Suri Duddella, please visit SuriNotes.com.


