
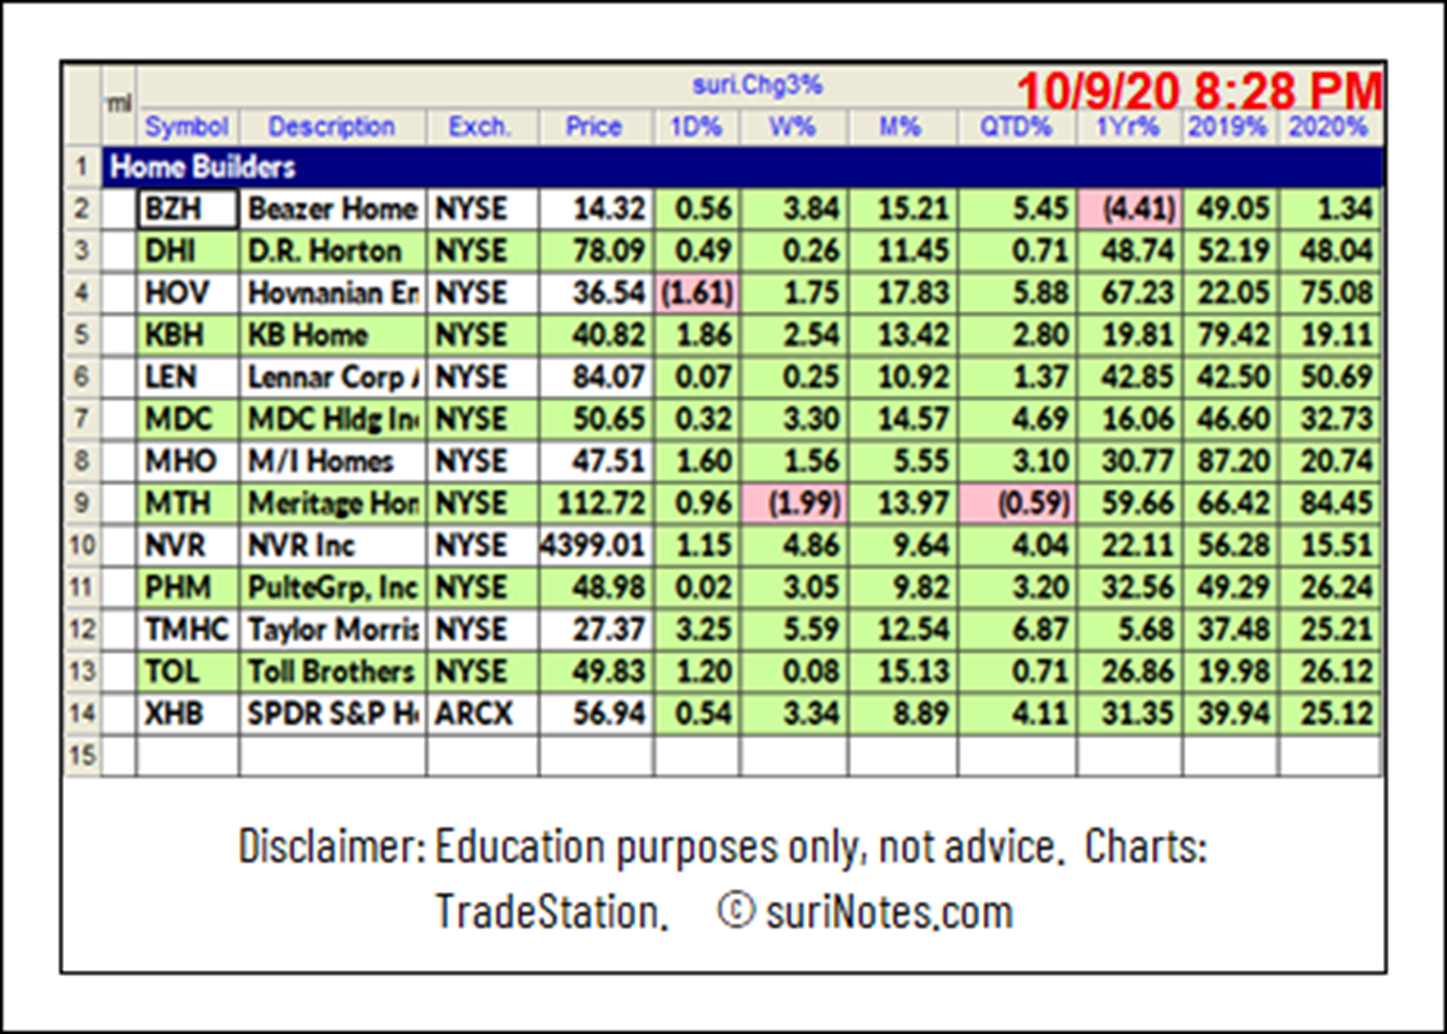
The home-building sector has outperformed the US markets in 2019 and 2020. The strong US stock market, lower interest rates, and demand from people to work from home due to Covid-19 situation are the tailwinds for the home-builder's industry, states Suri Duddella of suriNotes.com.
Homebuilders stocks are breaking out of key technical chart patterns like cup-&-handle patterns to provide some investing opportunities.
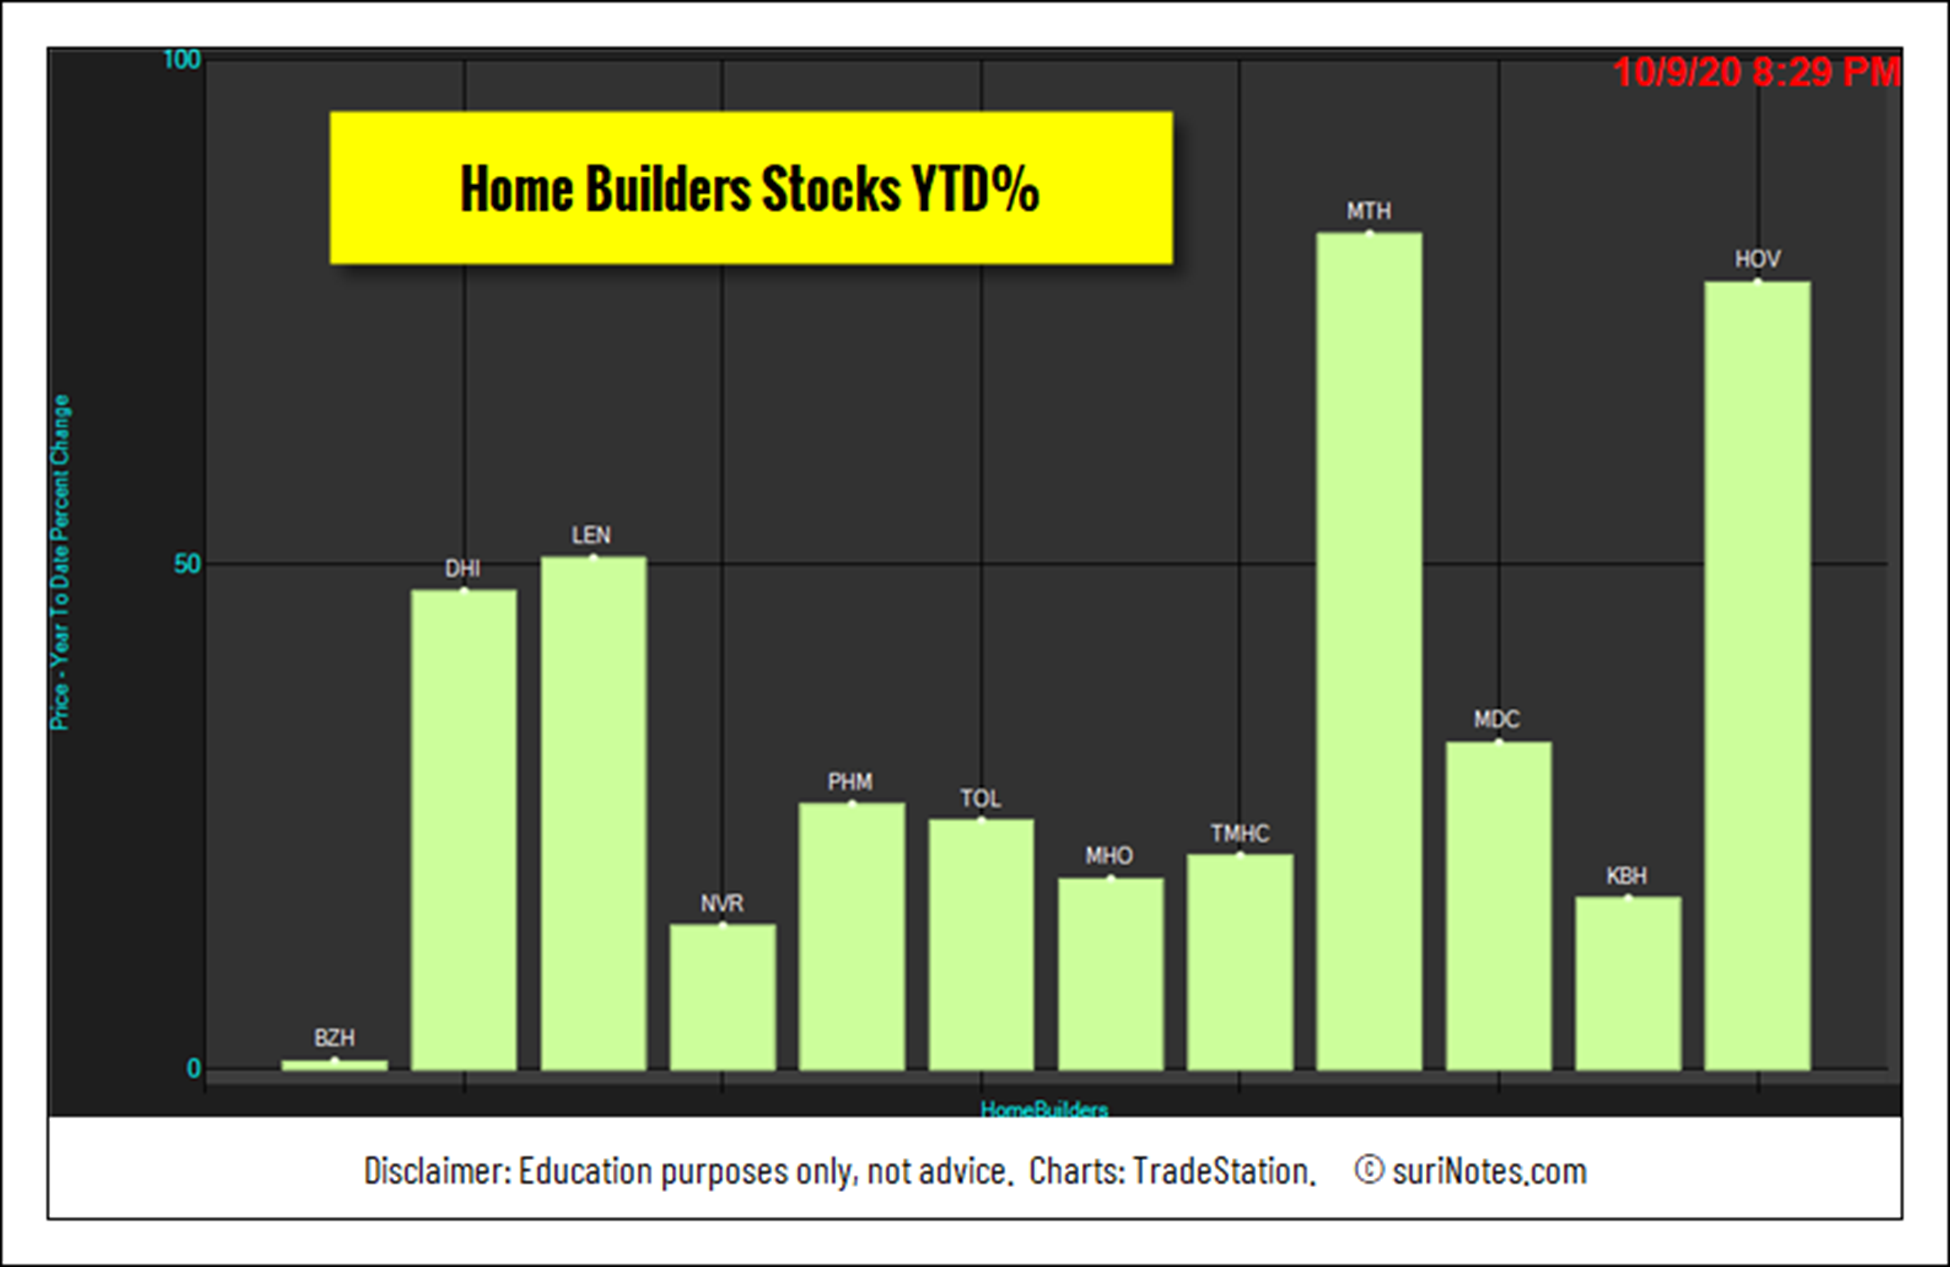
Home Builders Stocks and Their Returns for the Year 2019 & 2020:
Cup-&-Handle Patterns
The cup-and-handle chart pattern was developed and popularized by William J. O’Neil in the 1980s through his CANSLIM methodology, Investor’s Business Daily articles, and his book How to Make Money in Stocks.
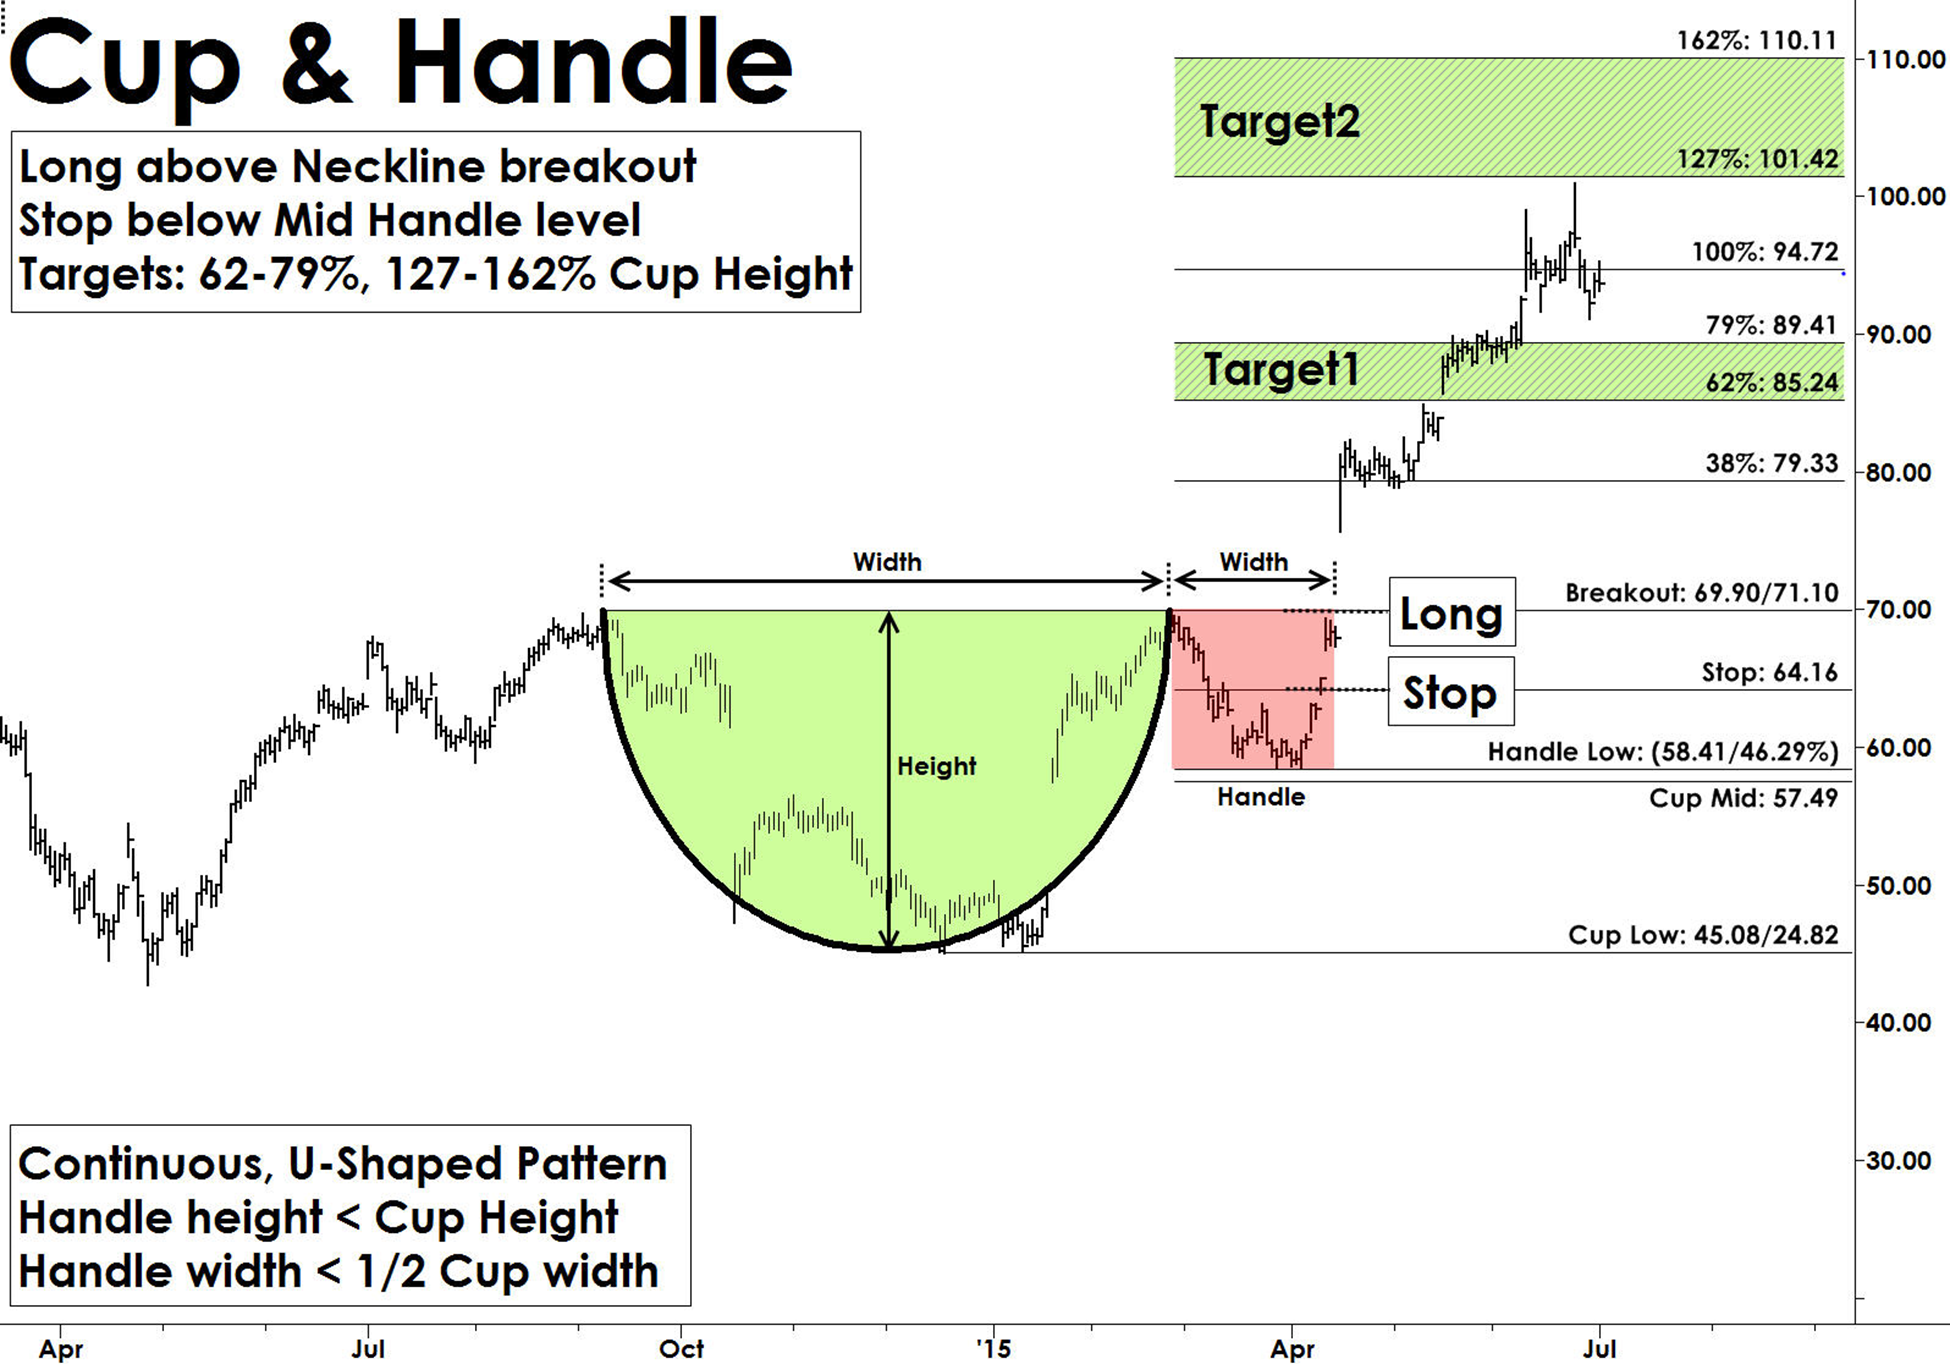
The cup-and-handle pattern resembles a cup with a handle and are continuation patterns that usually form in bullish trends. Most cup-and-handle patterns are reliable and offer great trading opportunities. They also form in all markets and in all timeframes. The “cup” formation is developed as consolidation phase during price rallies from the round bottom formation over multiple weeks to months. The “handle” part forms due to a price correction after “cup” formation and before a clear breakout to the upside.
Cup-and-handle pattern structures show the momentum pause after reaching a new high in a U-Shape form, followed by another attempt to breakout. When this breakout from the rim of the cup fails, it starts to fall back to build the "handle" structure. Usually, the handle structures are small, and the handle depth should not exceed more than 50% of cup depth. The handle part of the pattern generates interest in buyers as they expect the pattern to break out from these levels. The pattern is valid only if price convincingly breaks out with increased volume above the rim of the cup levels (see chart below).
Cup-&-Handle Chart Pattern Examples
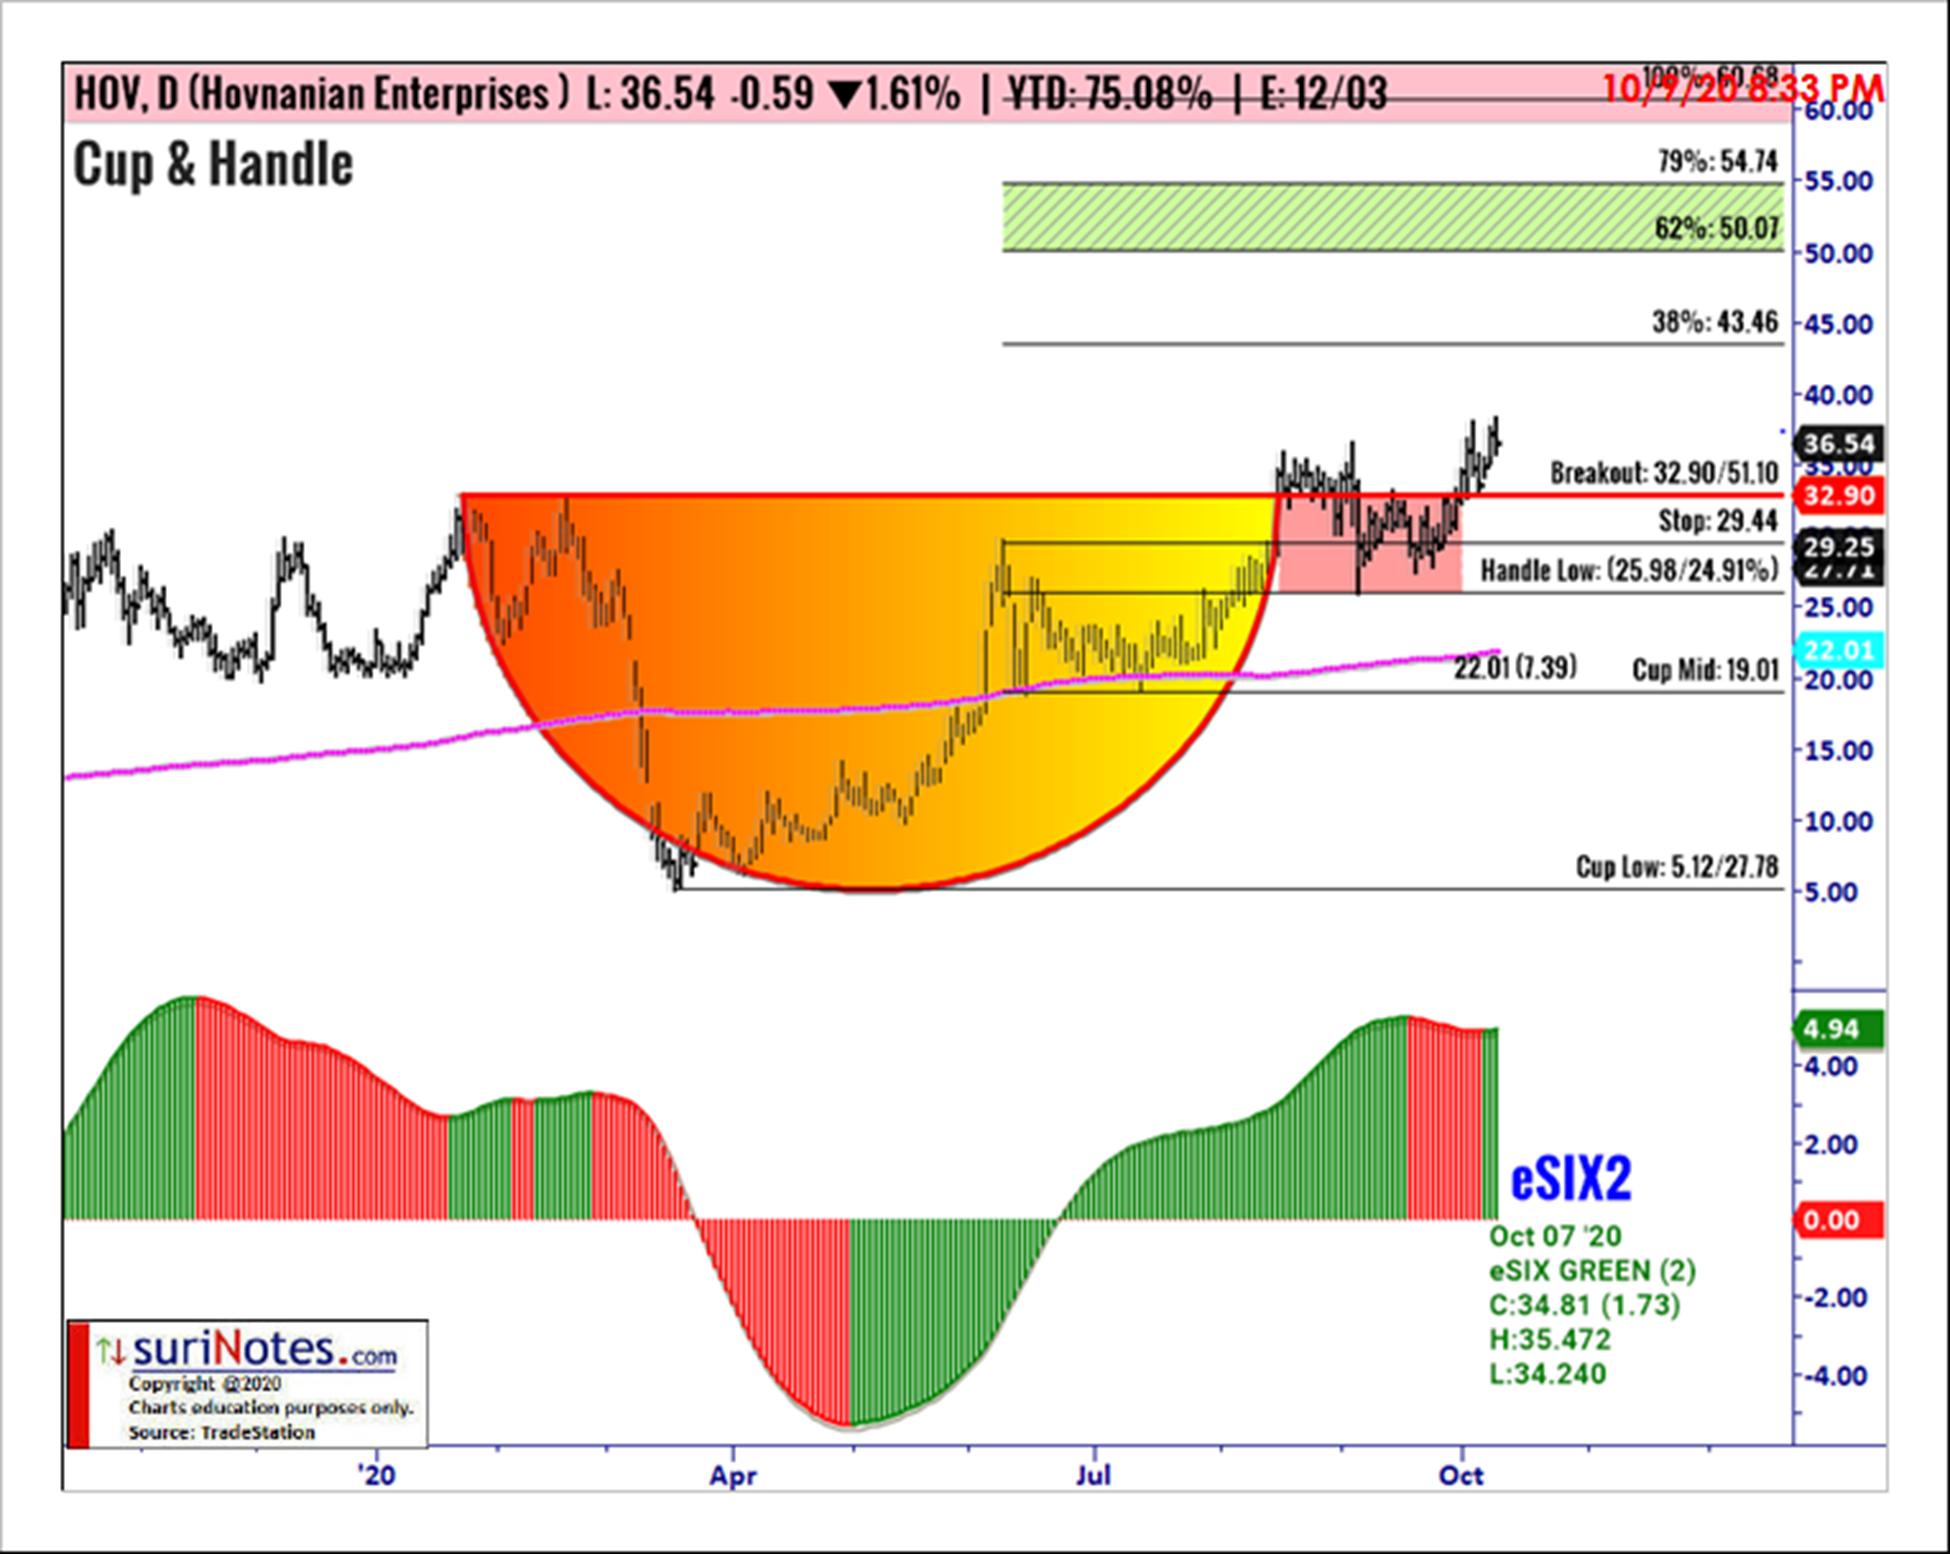
Hovnanian Enterprises Cl 'A' (HOV) has formed a cup-and-handle pattern on its daily chart and trading above the breakout level of $33.00. C&H patterns are valid only when price closes above the breakout level. A long trade is entered above the breakout level with a stop placed below the lowest low of the mid cup $19.01, and the handle low $25.98. Targets are placed at $43.46, $50.1 to $54.7 and 60.7.
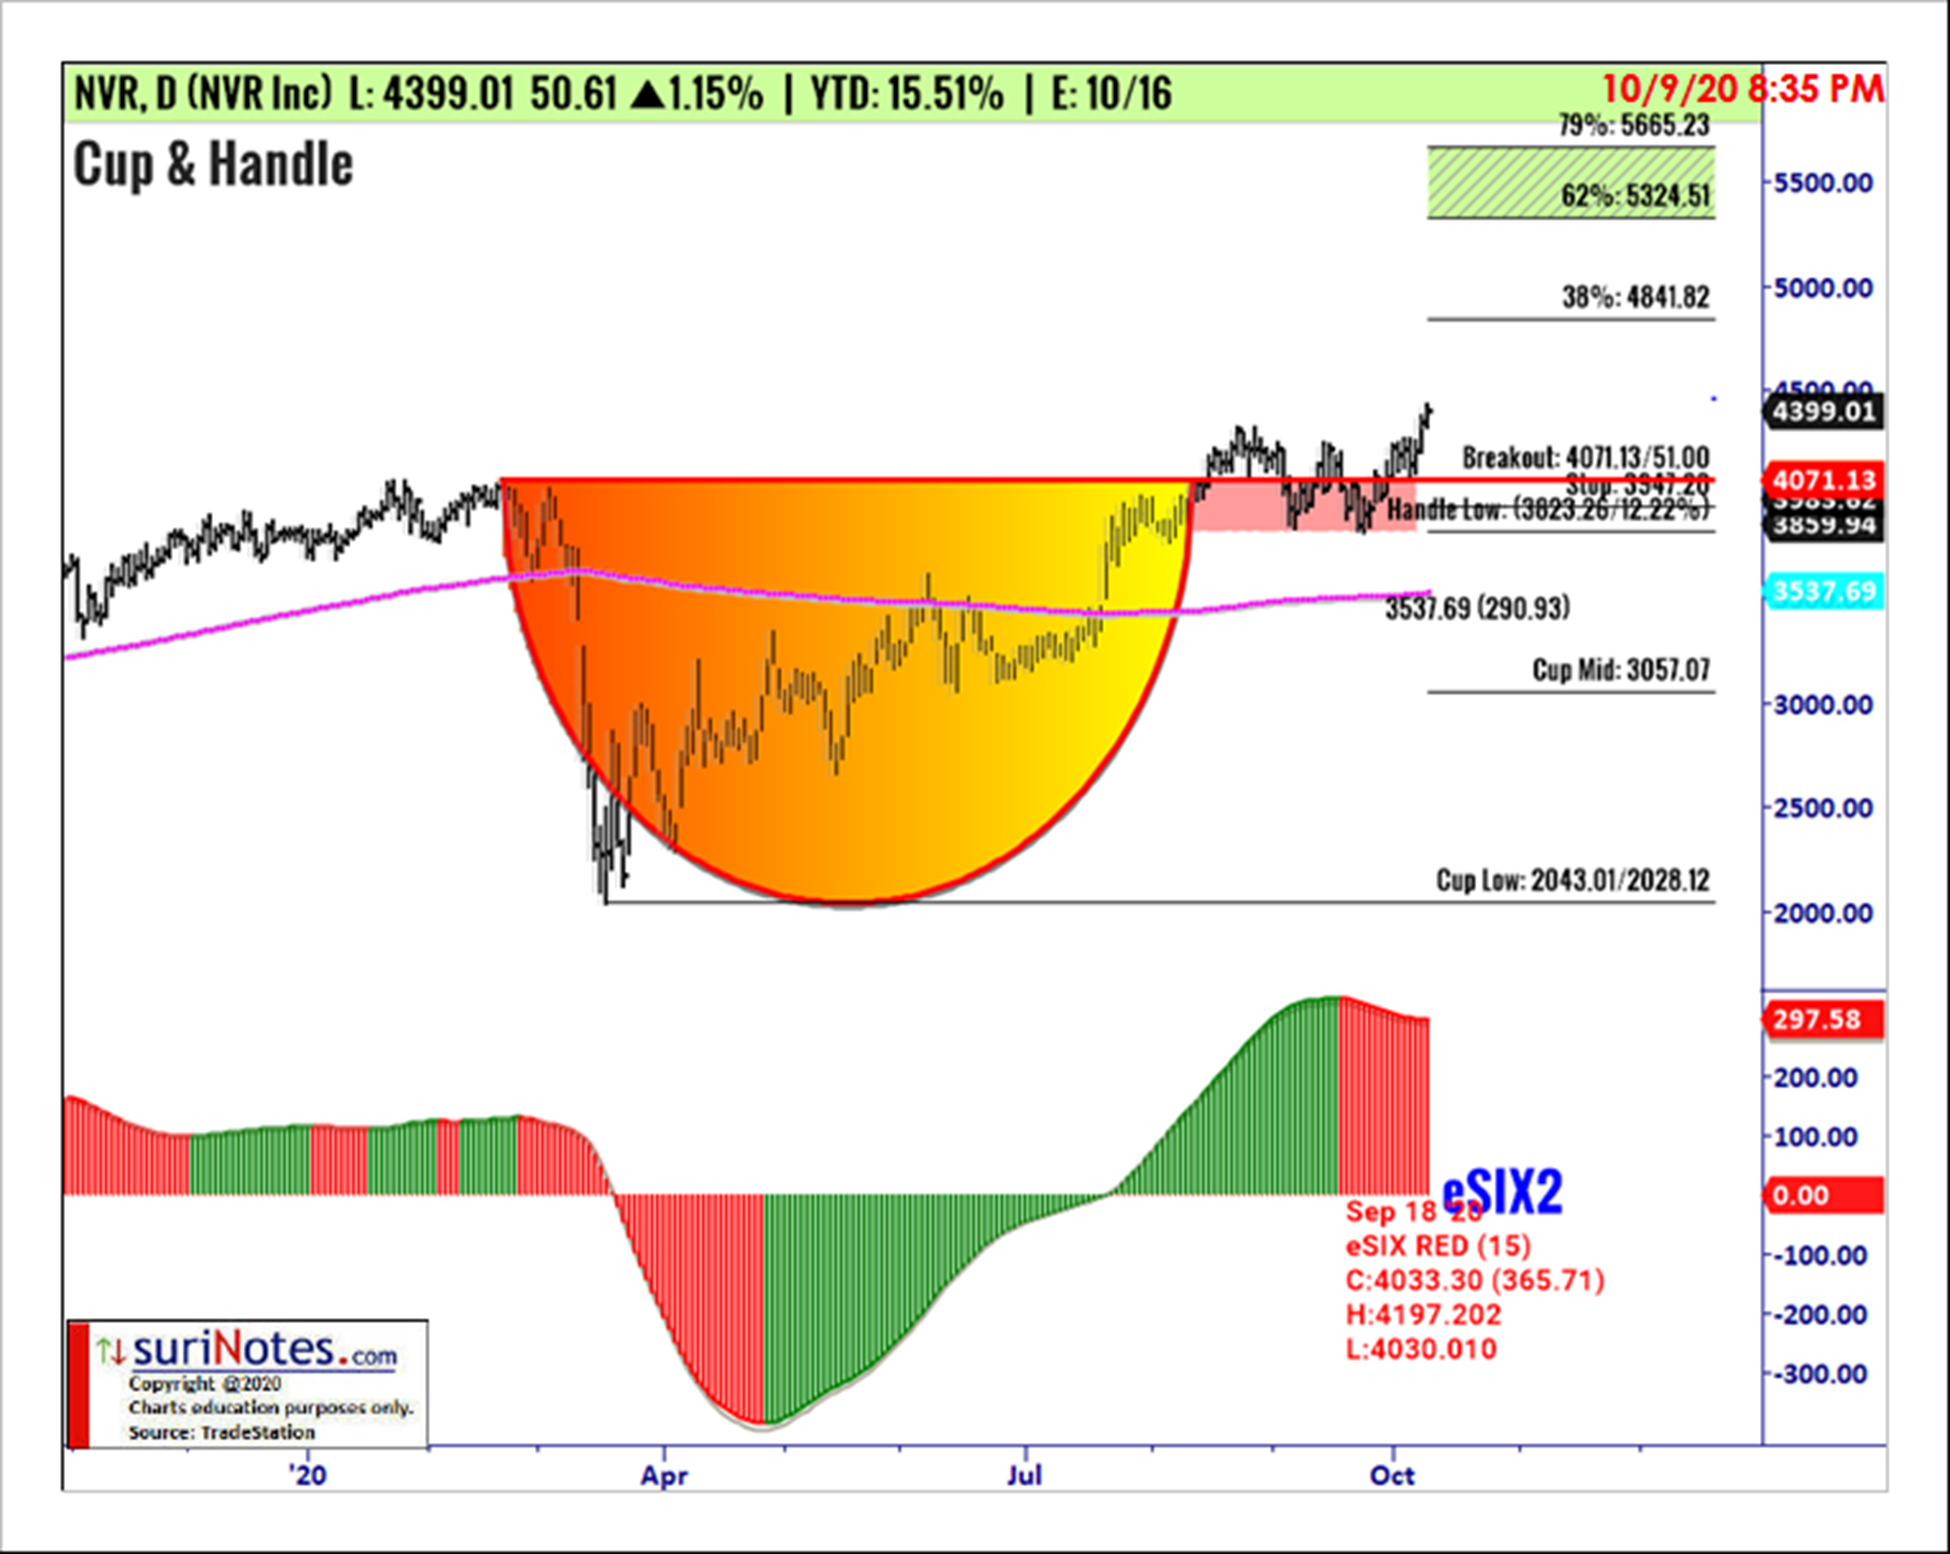
NVR Inc (NVR) has formed a cup-and-handle pattern on its daily chart and trading above the breakout level of $4071.23. C&H patterns are valid only when price closes above the breakout level. A long trade is entered above the breakout level with a stop placed below the lowest low of the mid-cup $3,057.07, and the handle low $3,823.26. Targets are placed at $4,841.82, $5,324.5 to $5,665.2, and $6,099.3.
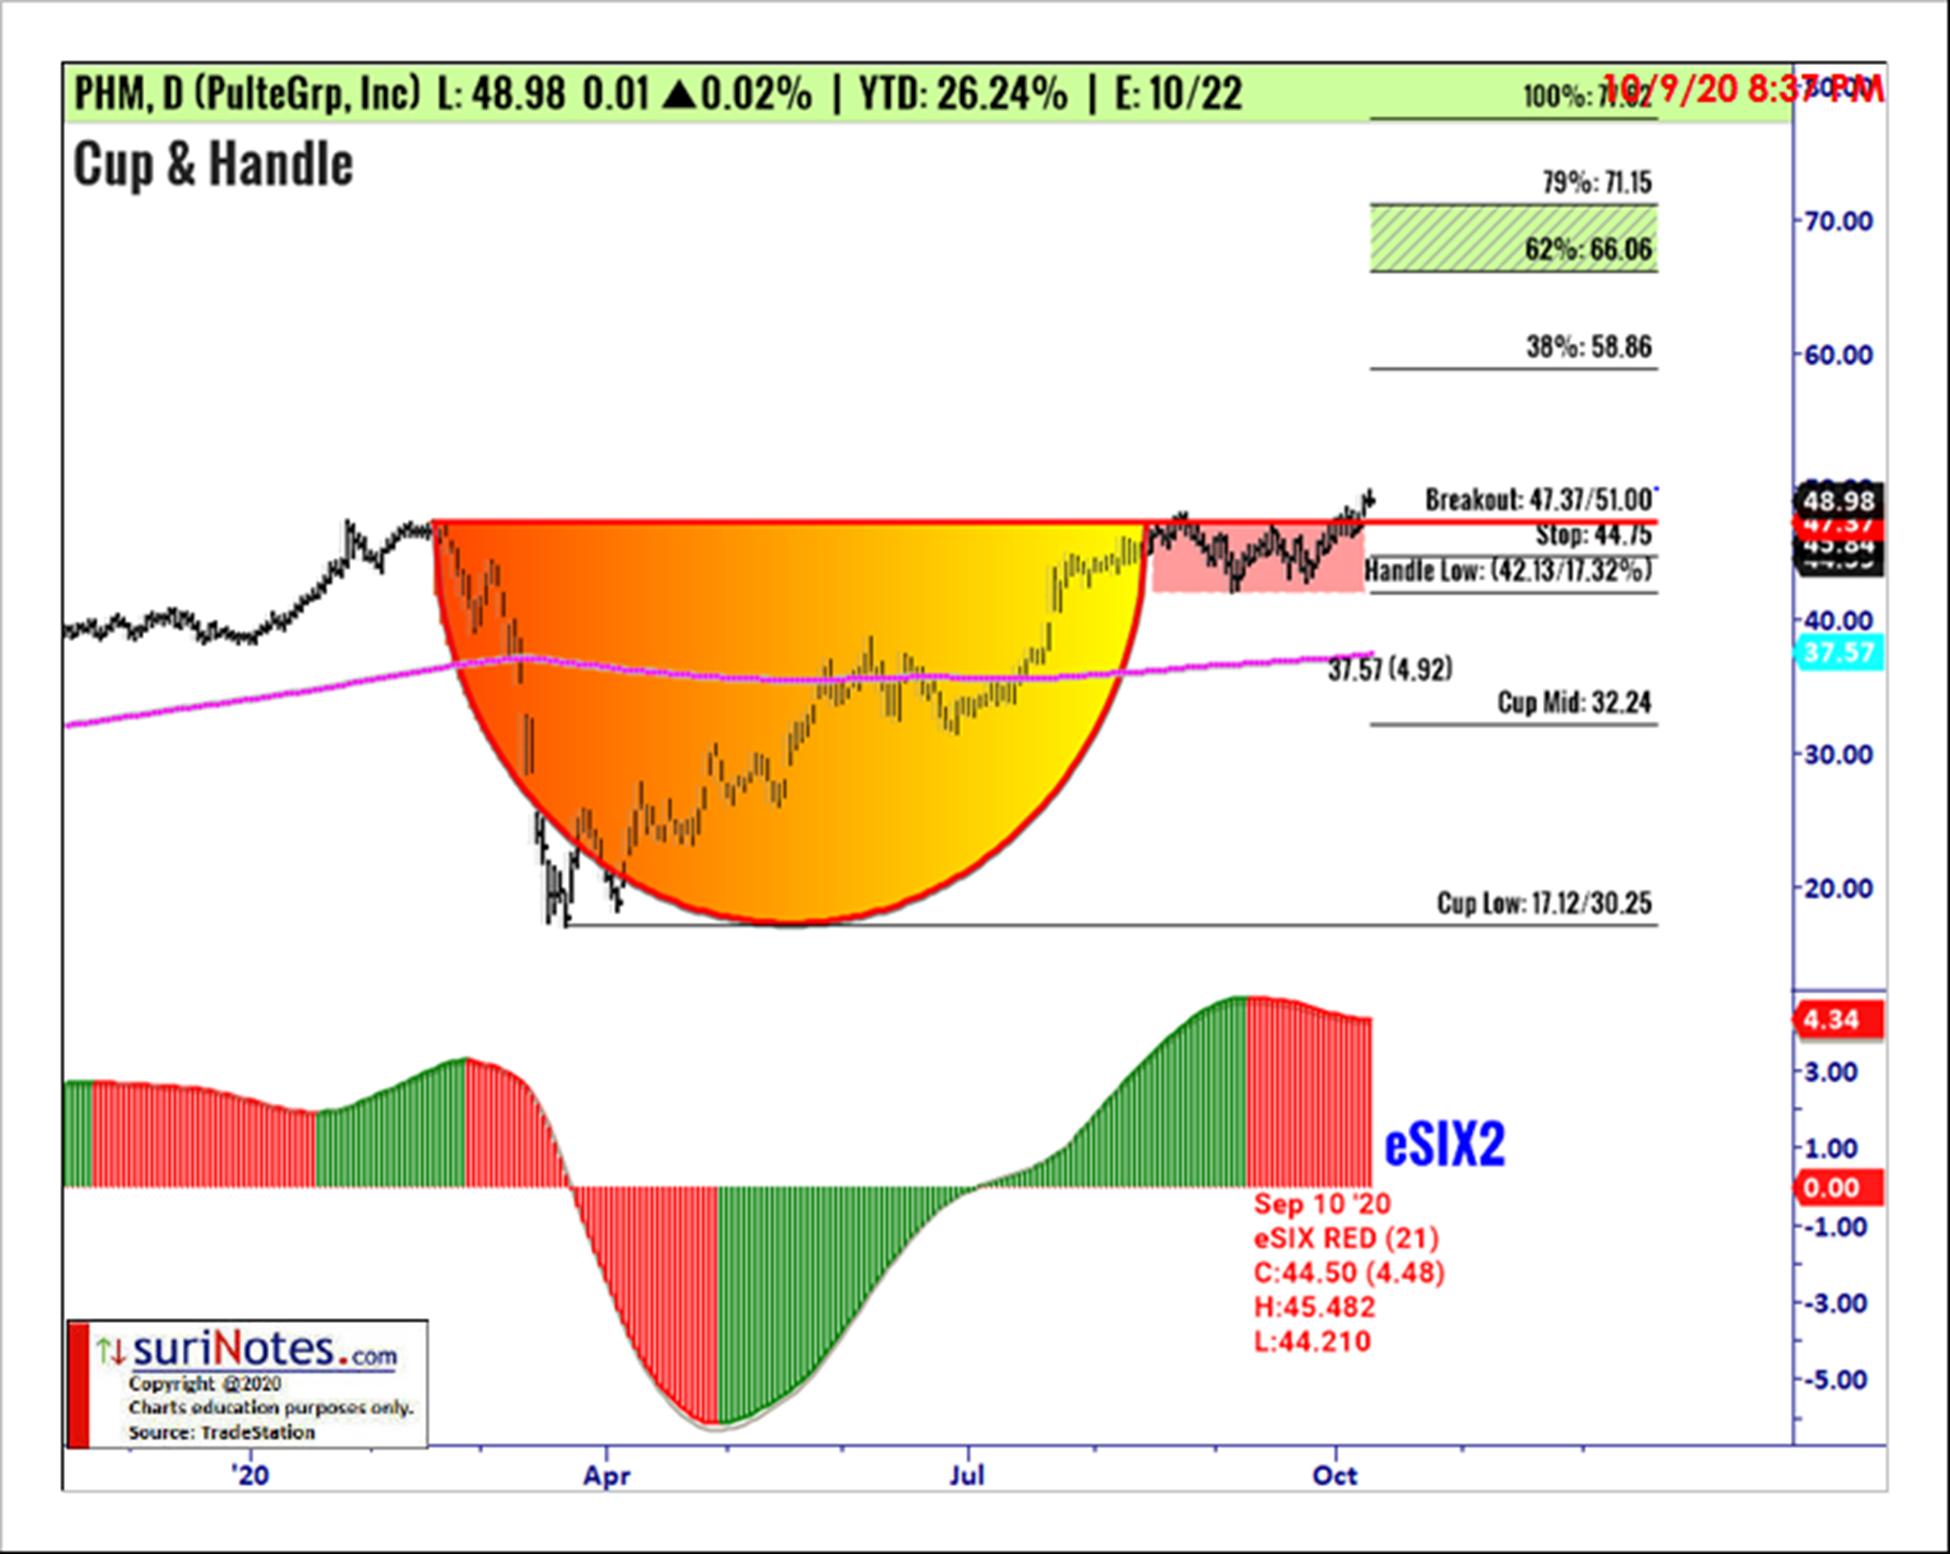
PulteGrp, Inc (PHM) is forming a cup-and-handle pattern on its daily chart and trading near the breakout level of $47.47. C&H patterns are valid only when price closes above the breakout level. A long trade is entered above the breakout level with a stop placed below the lowest low of the mid cup $32.24, and the handle low $42.13. Targets are placed at $58.86, $66.1 to $71.1.
To learn more about Suri Duddella, please visit SuriNotes.com.


