
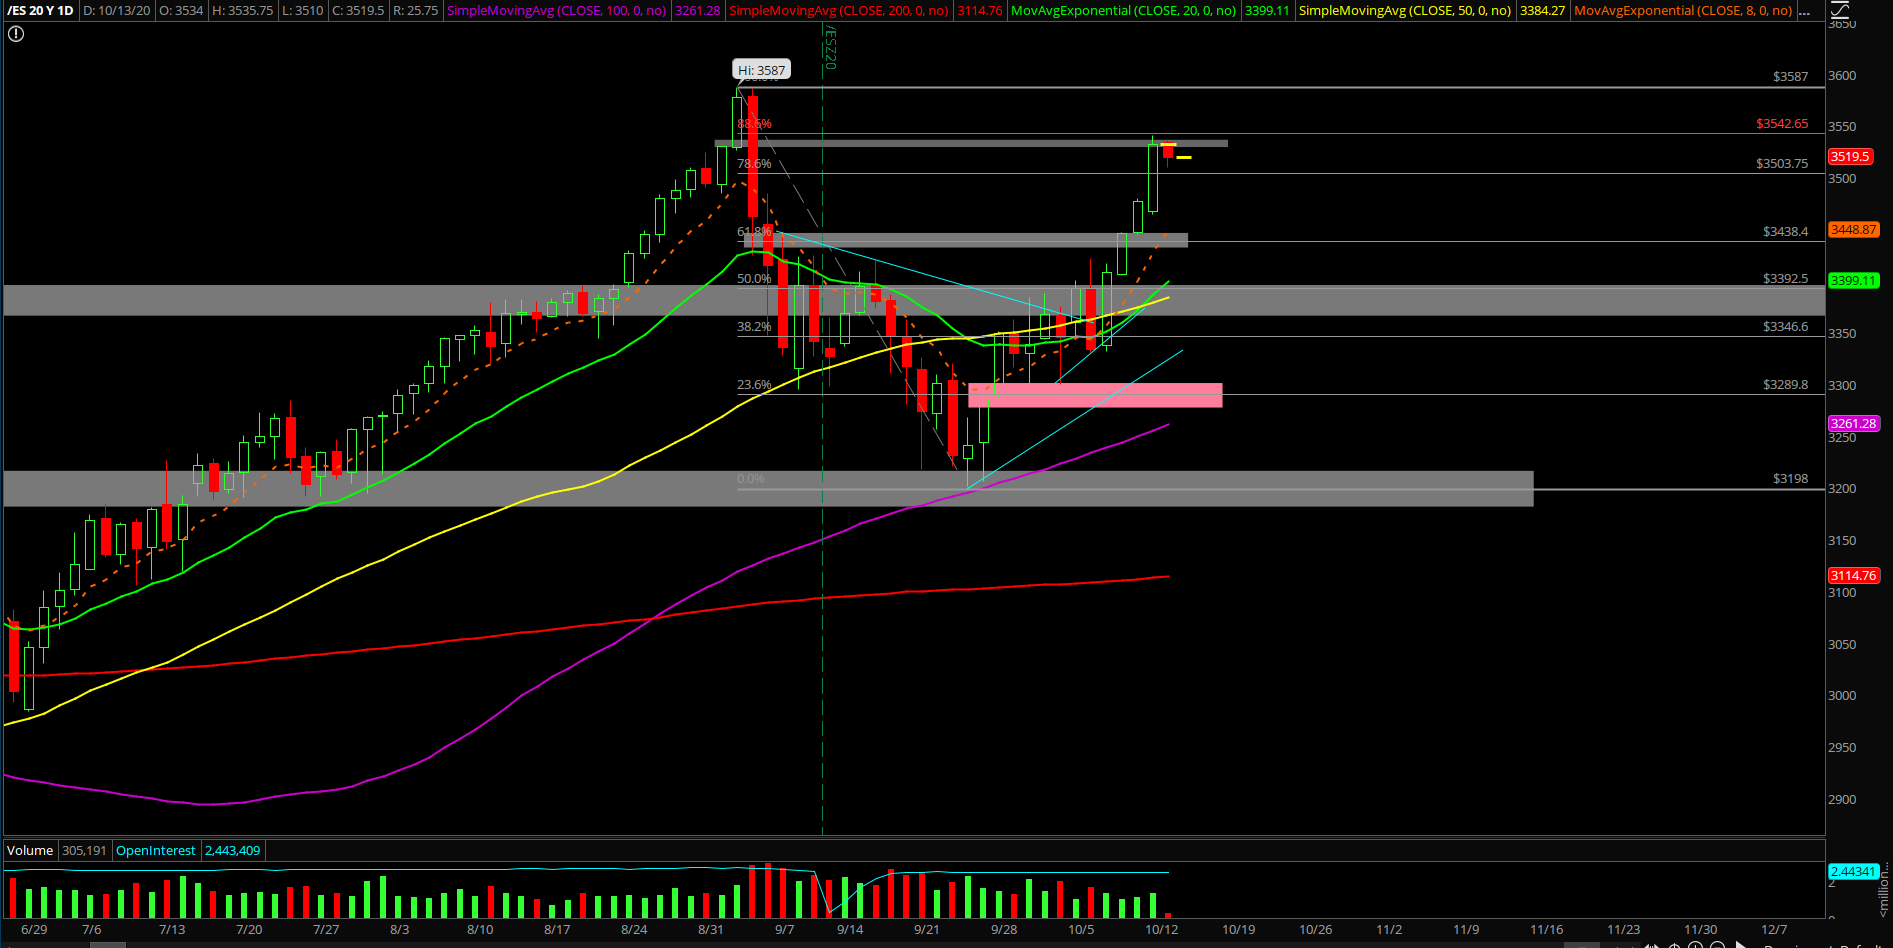
Monday was a "gap-up-and-go" session that did not look back in the rearview mirror as price action was able to decisively break above 3500s on the Emini S&P 500 (ES). This is the 78.6% retracement of the entire drop (3587-3198), reports Ricky Wen of ElliottWaveTrader.net.
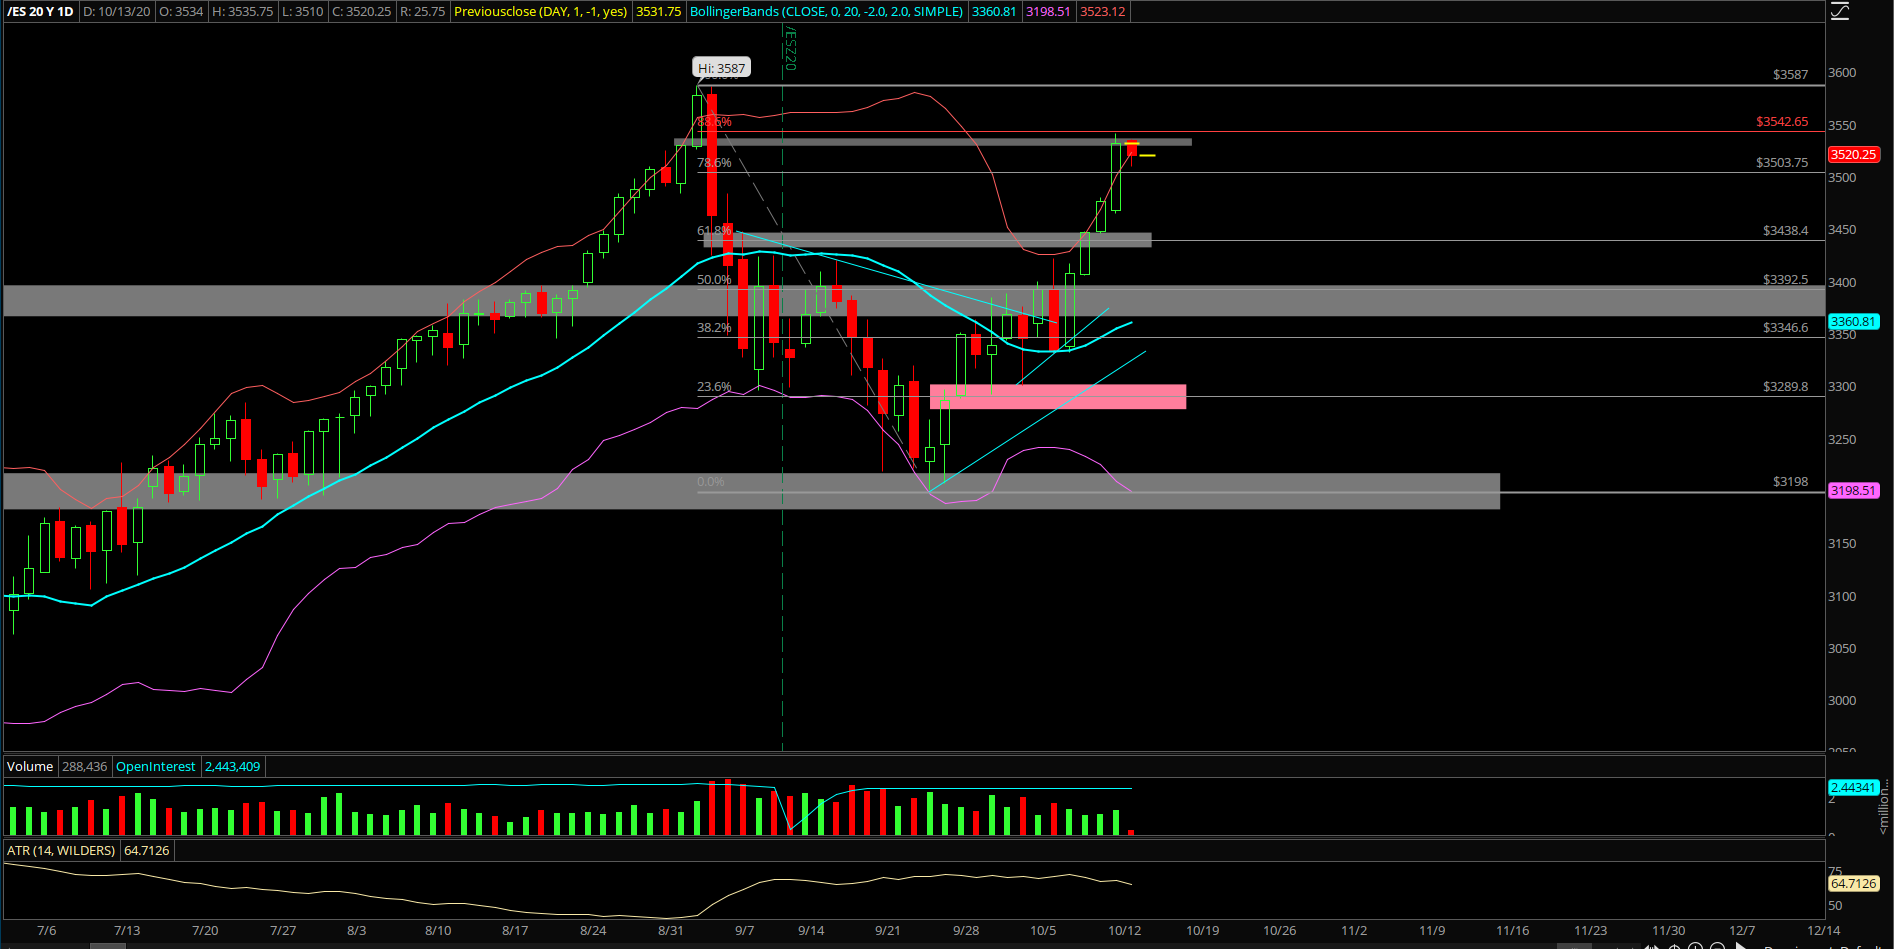
In addition, the market made its way into the 3540s area, which was also a key level around the 88.6% retracement. All in all, it was a decisive daily bullish trend day that also managed to close above two standard deviation channel highs.
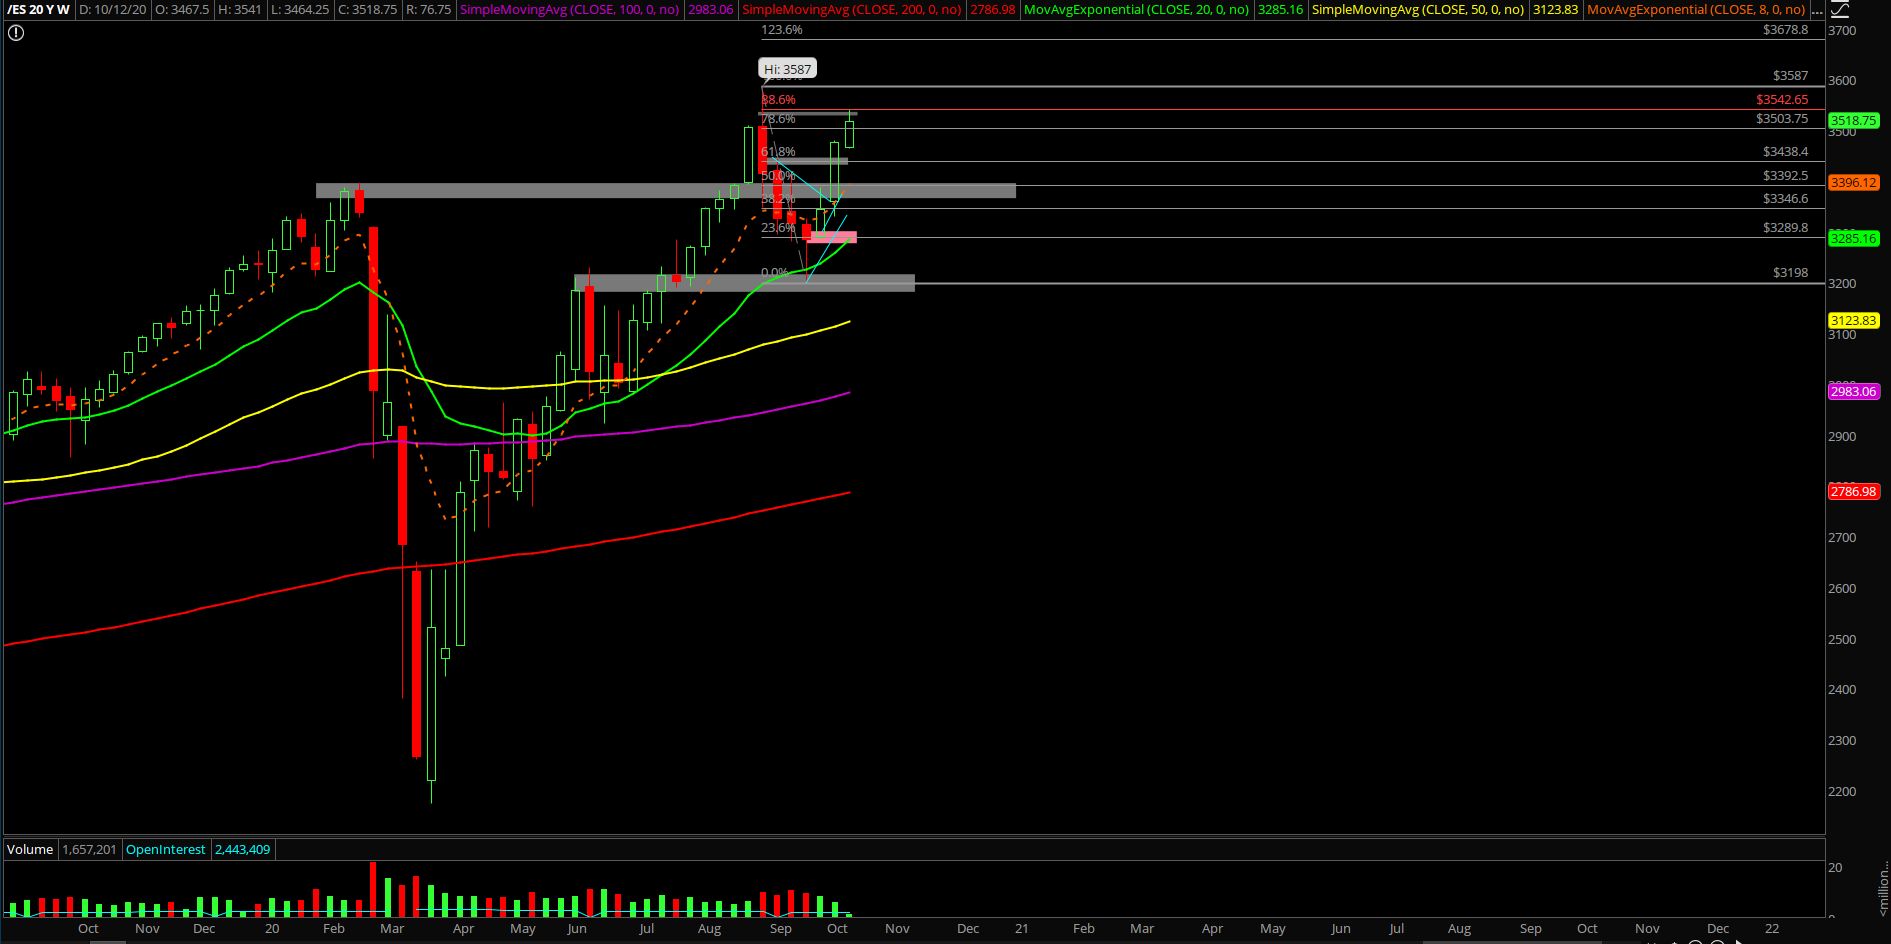
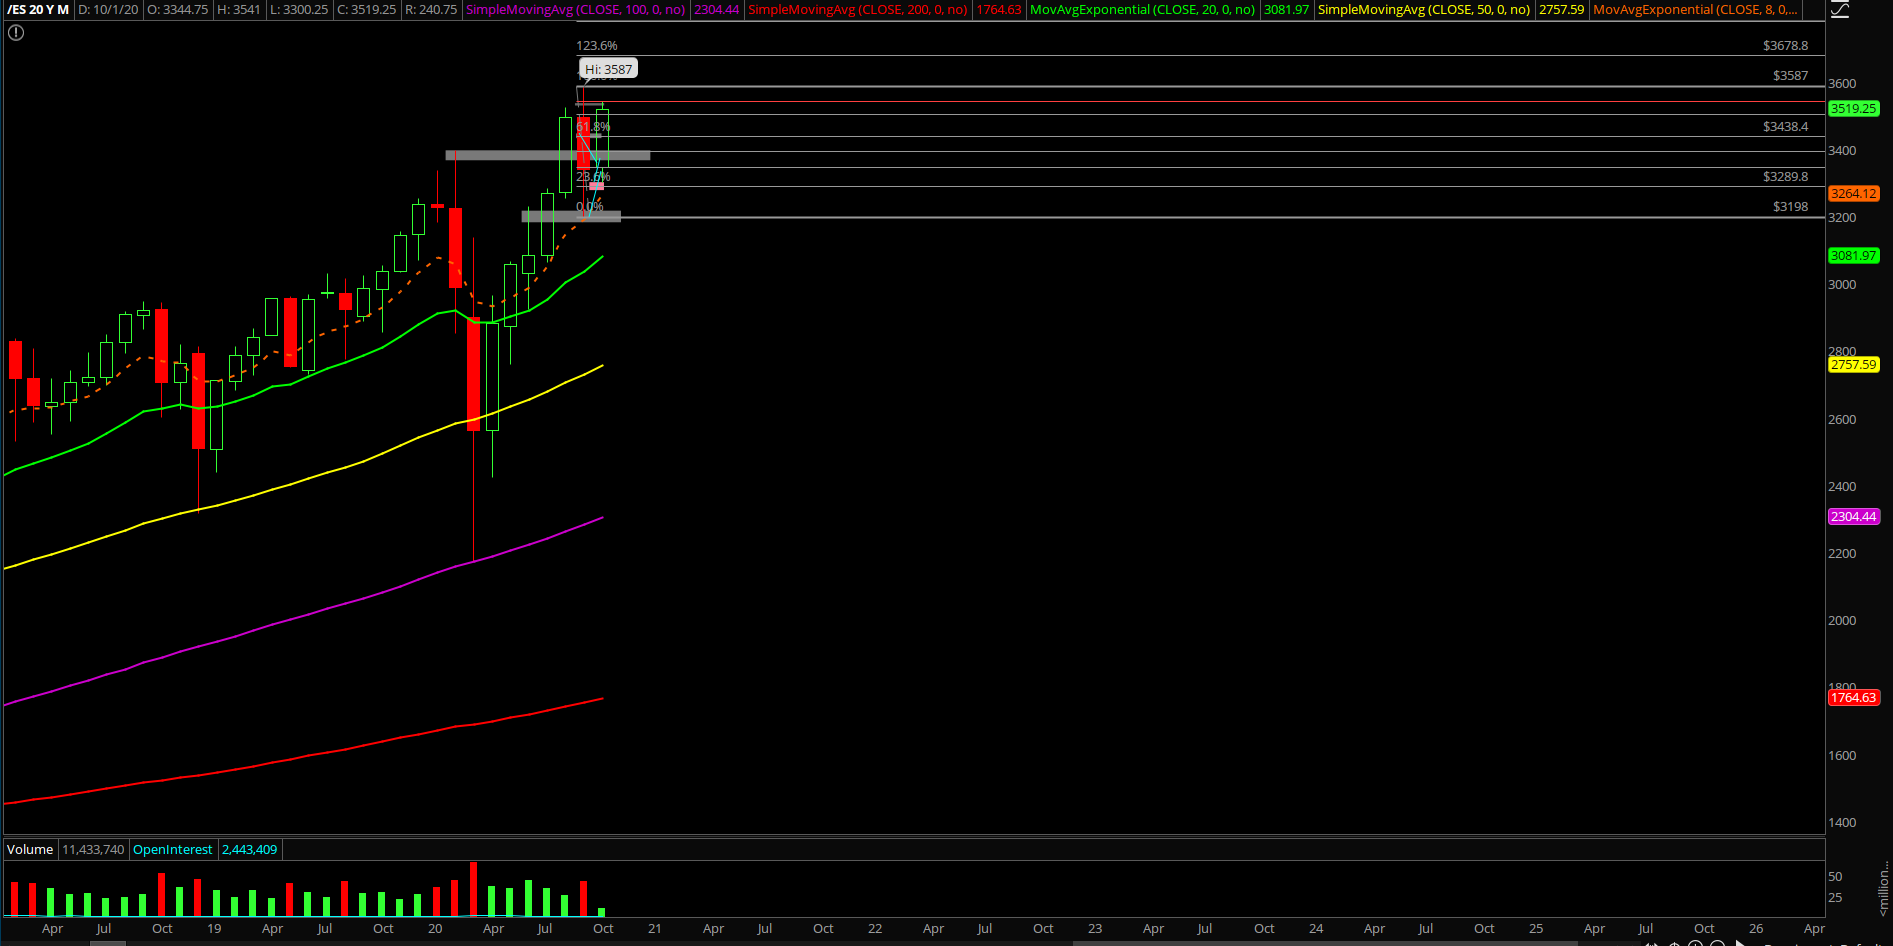
The main takeaway for the bigger picture timeframe remains the same: The ES 3198 temporary bottom from Sept 24 could be the bigger picture bottom as we head into the rest of Q4 2020. This is a possibility given that price "stick-saved"/bottomed against a key support confluence and has been building a basing pattern since then.
Obviously, the wild card is the upcoming elections and likely the volatility/whipsaw will commence shortly and test this theory. We just have to implant that idea if this year is going for the year-end highs closing print again as we discussed a few times since the V-shape reversal from March.
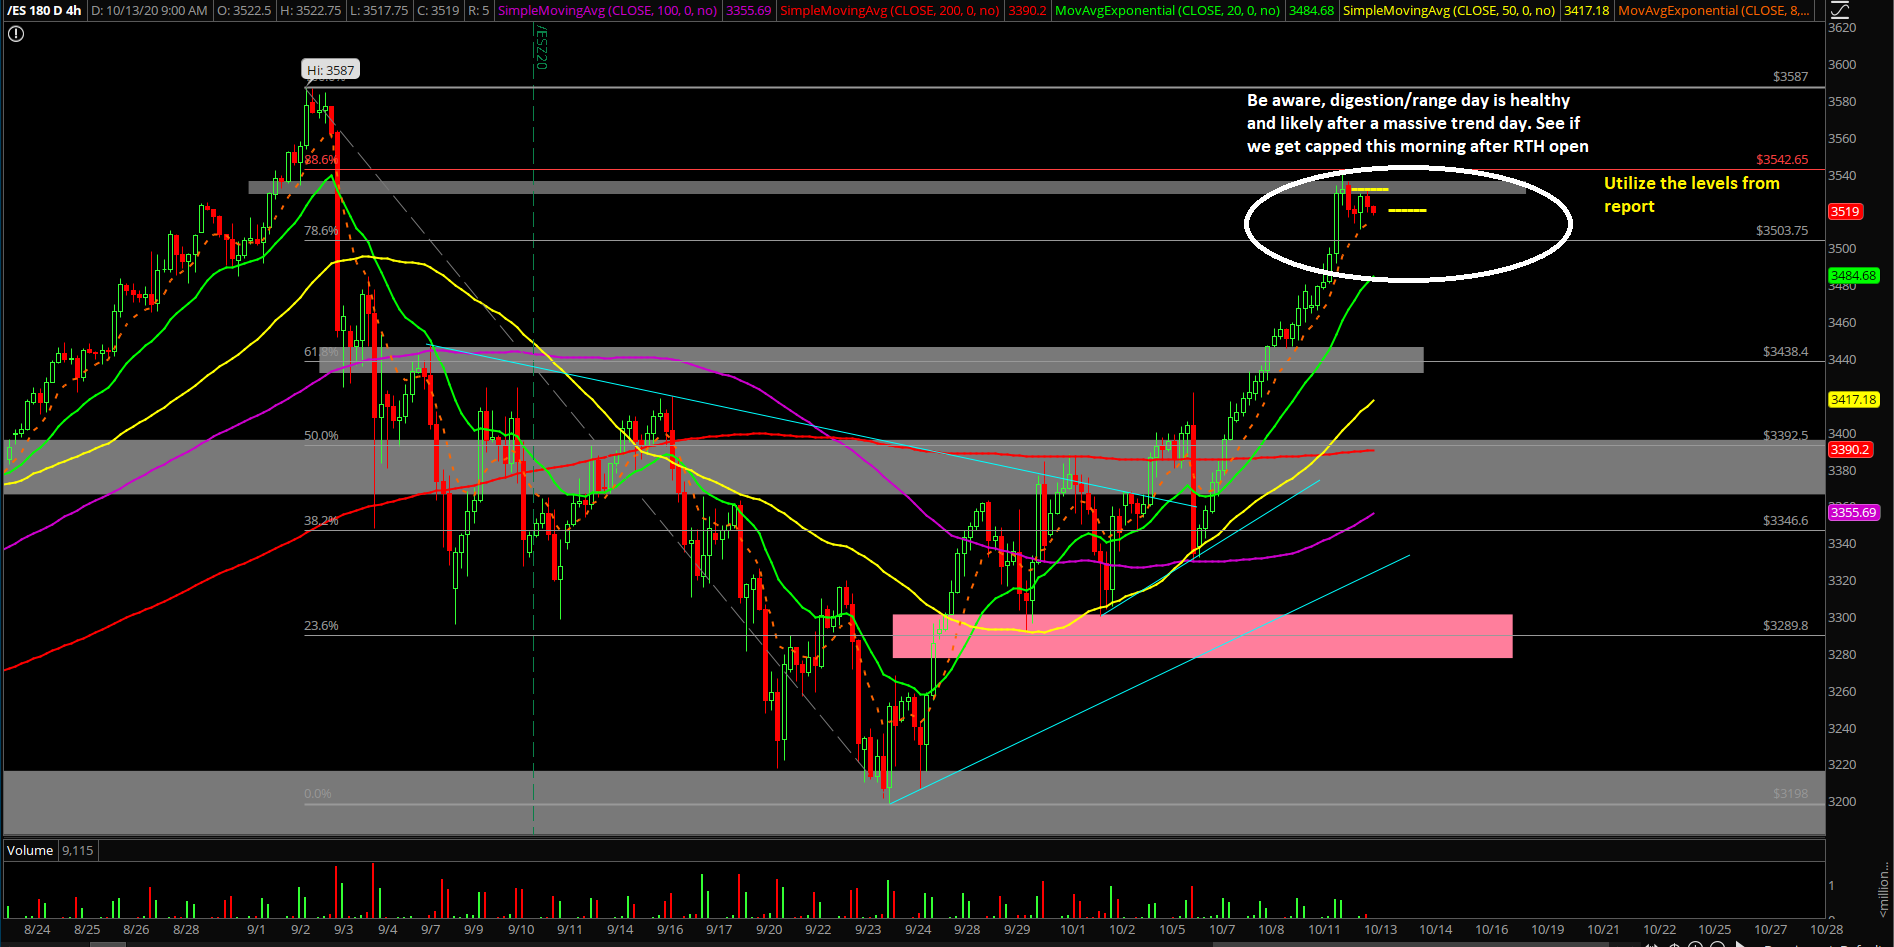
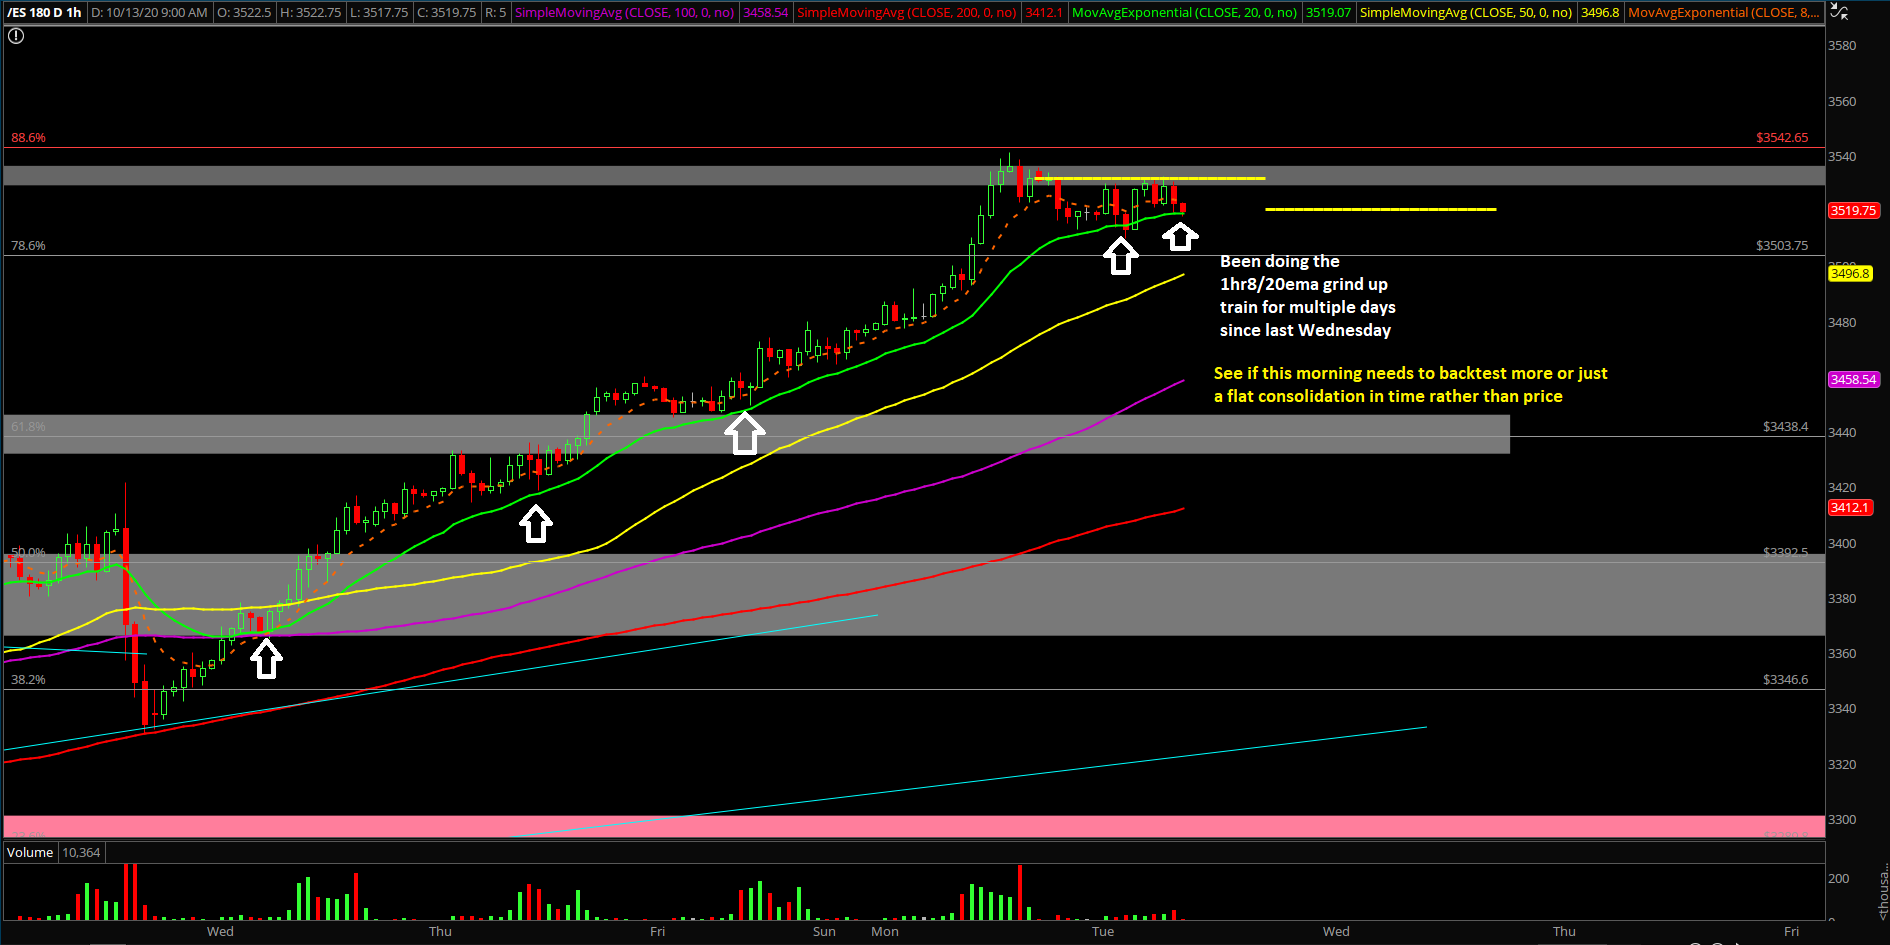
What’s next? Monday closed at 3531.75 on the ES, around the highs of the session, to confirm a decisive reclamation of 3500. Going into today, it’s easy to see the digestion pattern given what occurred overnight with the tight flag/high-level consolidation setup, so traders must be aware of not chasing too high and let it reset thorough time or price.
Summarizing our market view and game plan:
- Yesterday was a massive trend day up that exhibited a gap up and go structure, so today be aware of the likely digestion/capped range day/high level consolidation patterns.
- Wait for RTH open to see how tight today’s range is going to be given it’s likely some sort of digestion to eventually go higher at a later date. Educated guess would be 3535-3475 overall.
- Utilizing overnight low 3510 and overnight high 3535.75 as the most immediate range.
- Above 3535.75, opens up 3541, 3550, 3565 with level by level approach.
- Below 3510, opens up 3500 and 3475 with level by level approach.
- Traders must continue to look for buyable dip opportunities, similar to last week, but be on the outlook for more whipsaw because of the confluence of levels ahead here to reset a bit first. In addition, price is a bit capped to the upside towards all-time highs (only 2%~ away) compared to last week when the room to upside was much greater. Subject to change.
- This means that even if market dips into the key supports such as 3500/3475, the odds are with the higher timeframes being buyable due to the ongoing daily/weekly/monthly upside trend.
- At this point, in regard to immediate momentum, the must hold daily closing print has moved up from 3445 into 3460. A break below it on a daily closing print would cause a hinderance on the immediate daily momentum because that’s the low area from Sunday (current week’s low). Know your timeframes.
See chart reviews and projections on the Emini S&P 500:
Ricky Wen is an analyst at ElliottWaveTrader.net, where he hosts the ES Trade Alerts premium subscription service.


