
The 2020 oil price war and the Covid-19 pandemic situation drove oil prices and energy stocks down worldwide, states Suri Duddella of suriNotes.com.
As the world recovers from the Covid-19 pandemic, energy stocks may see a potential bounce from the low prices. Some of the energy stocks are building harmonic chart patterns.
The energy sector consists of companies of exploration, production, and renewable energy companies.
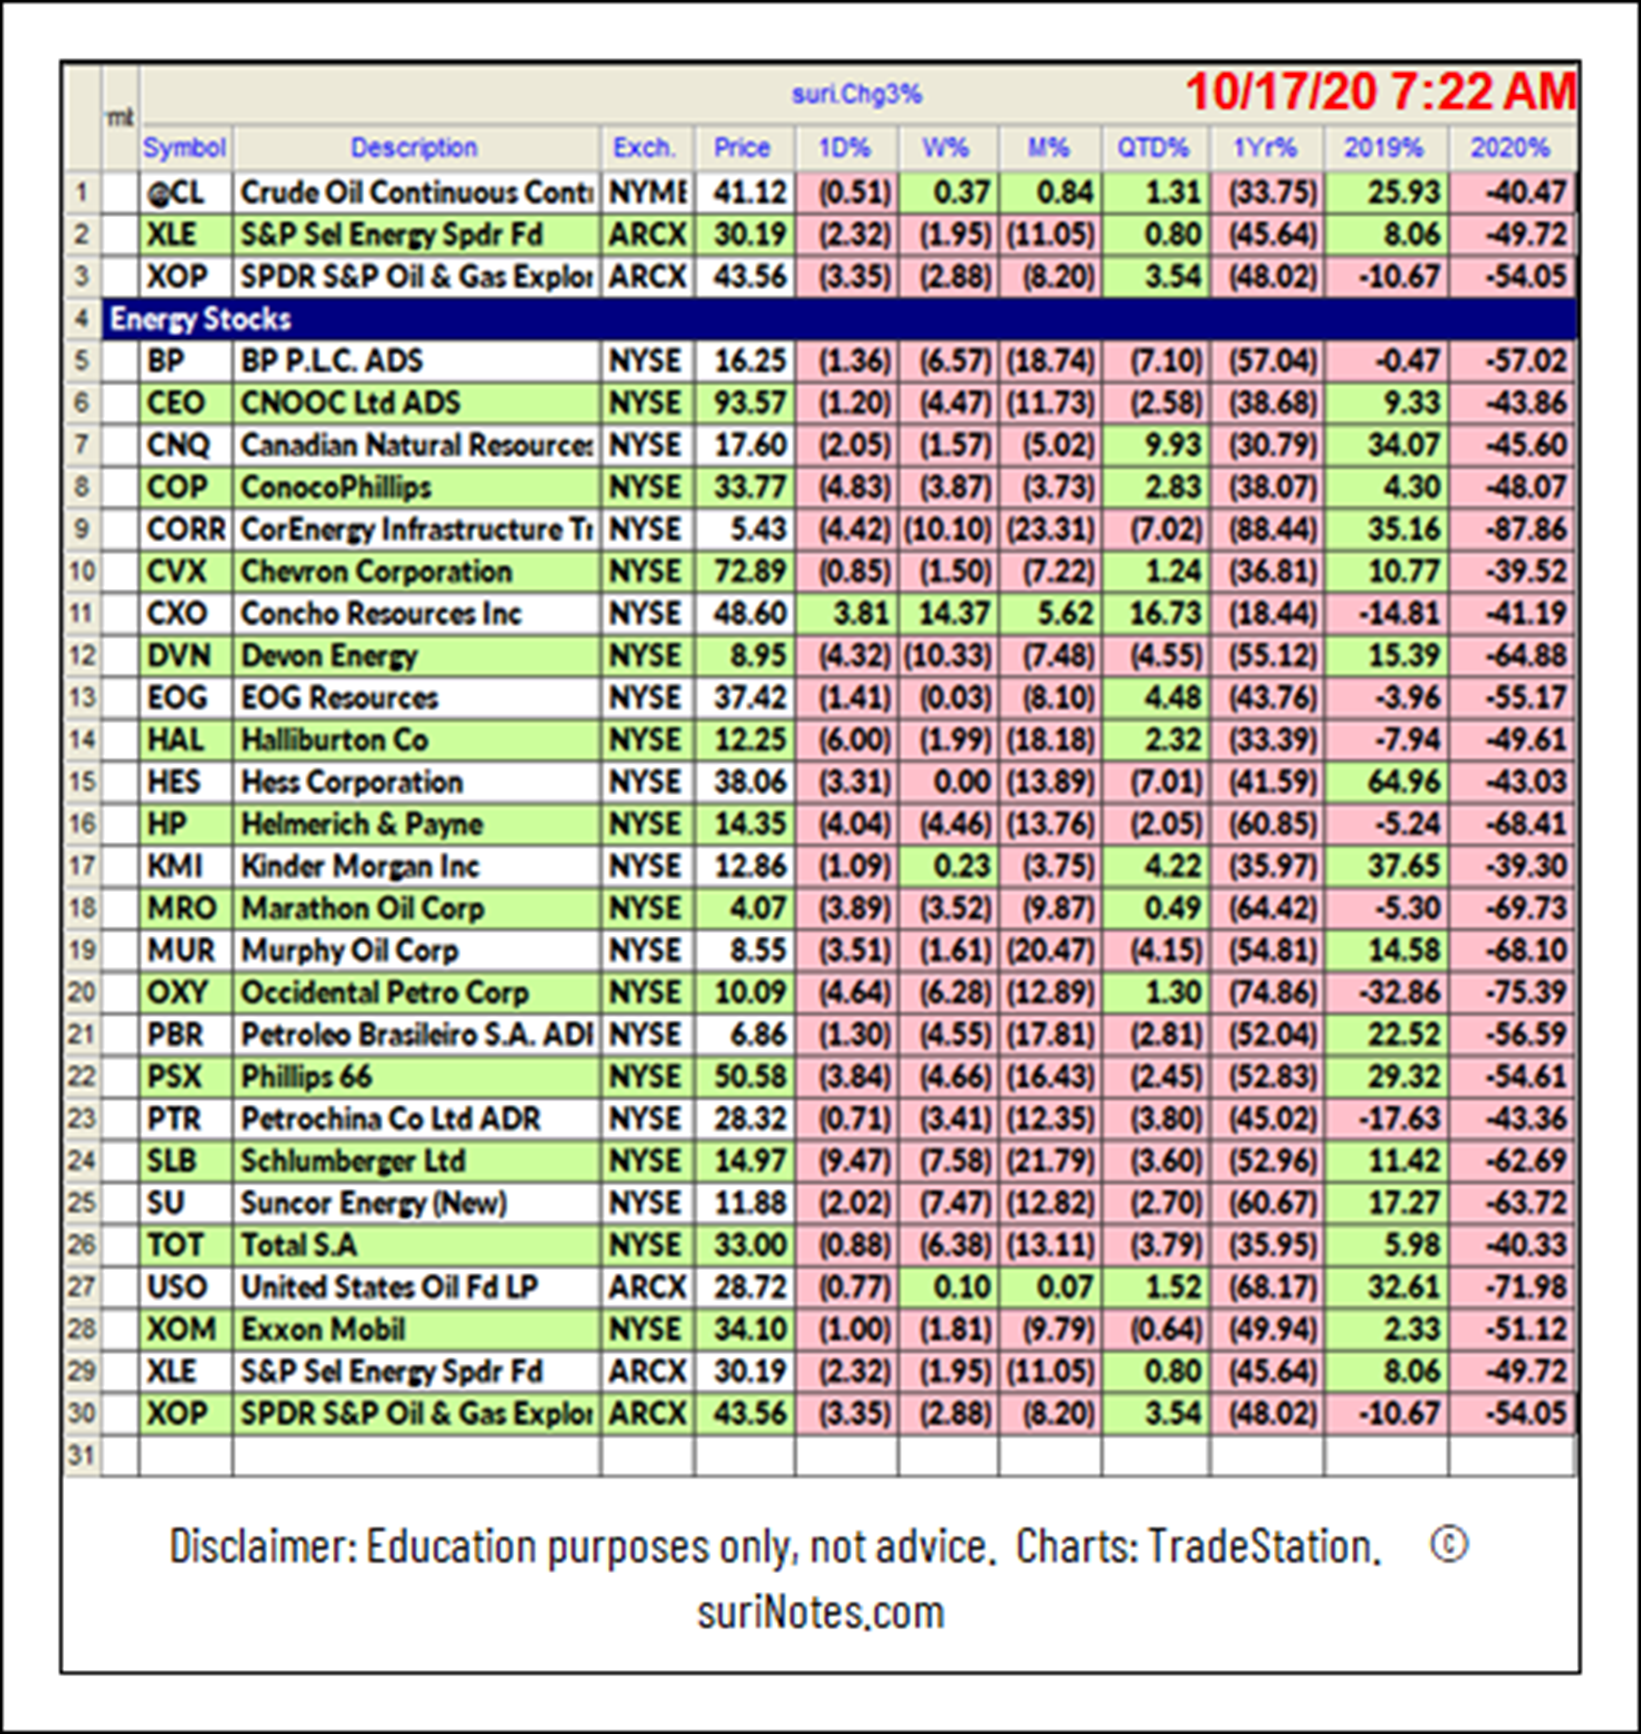
Here is a list of energy stocks.
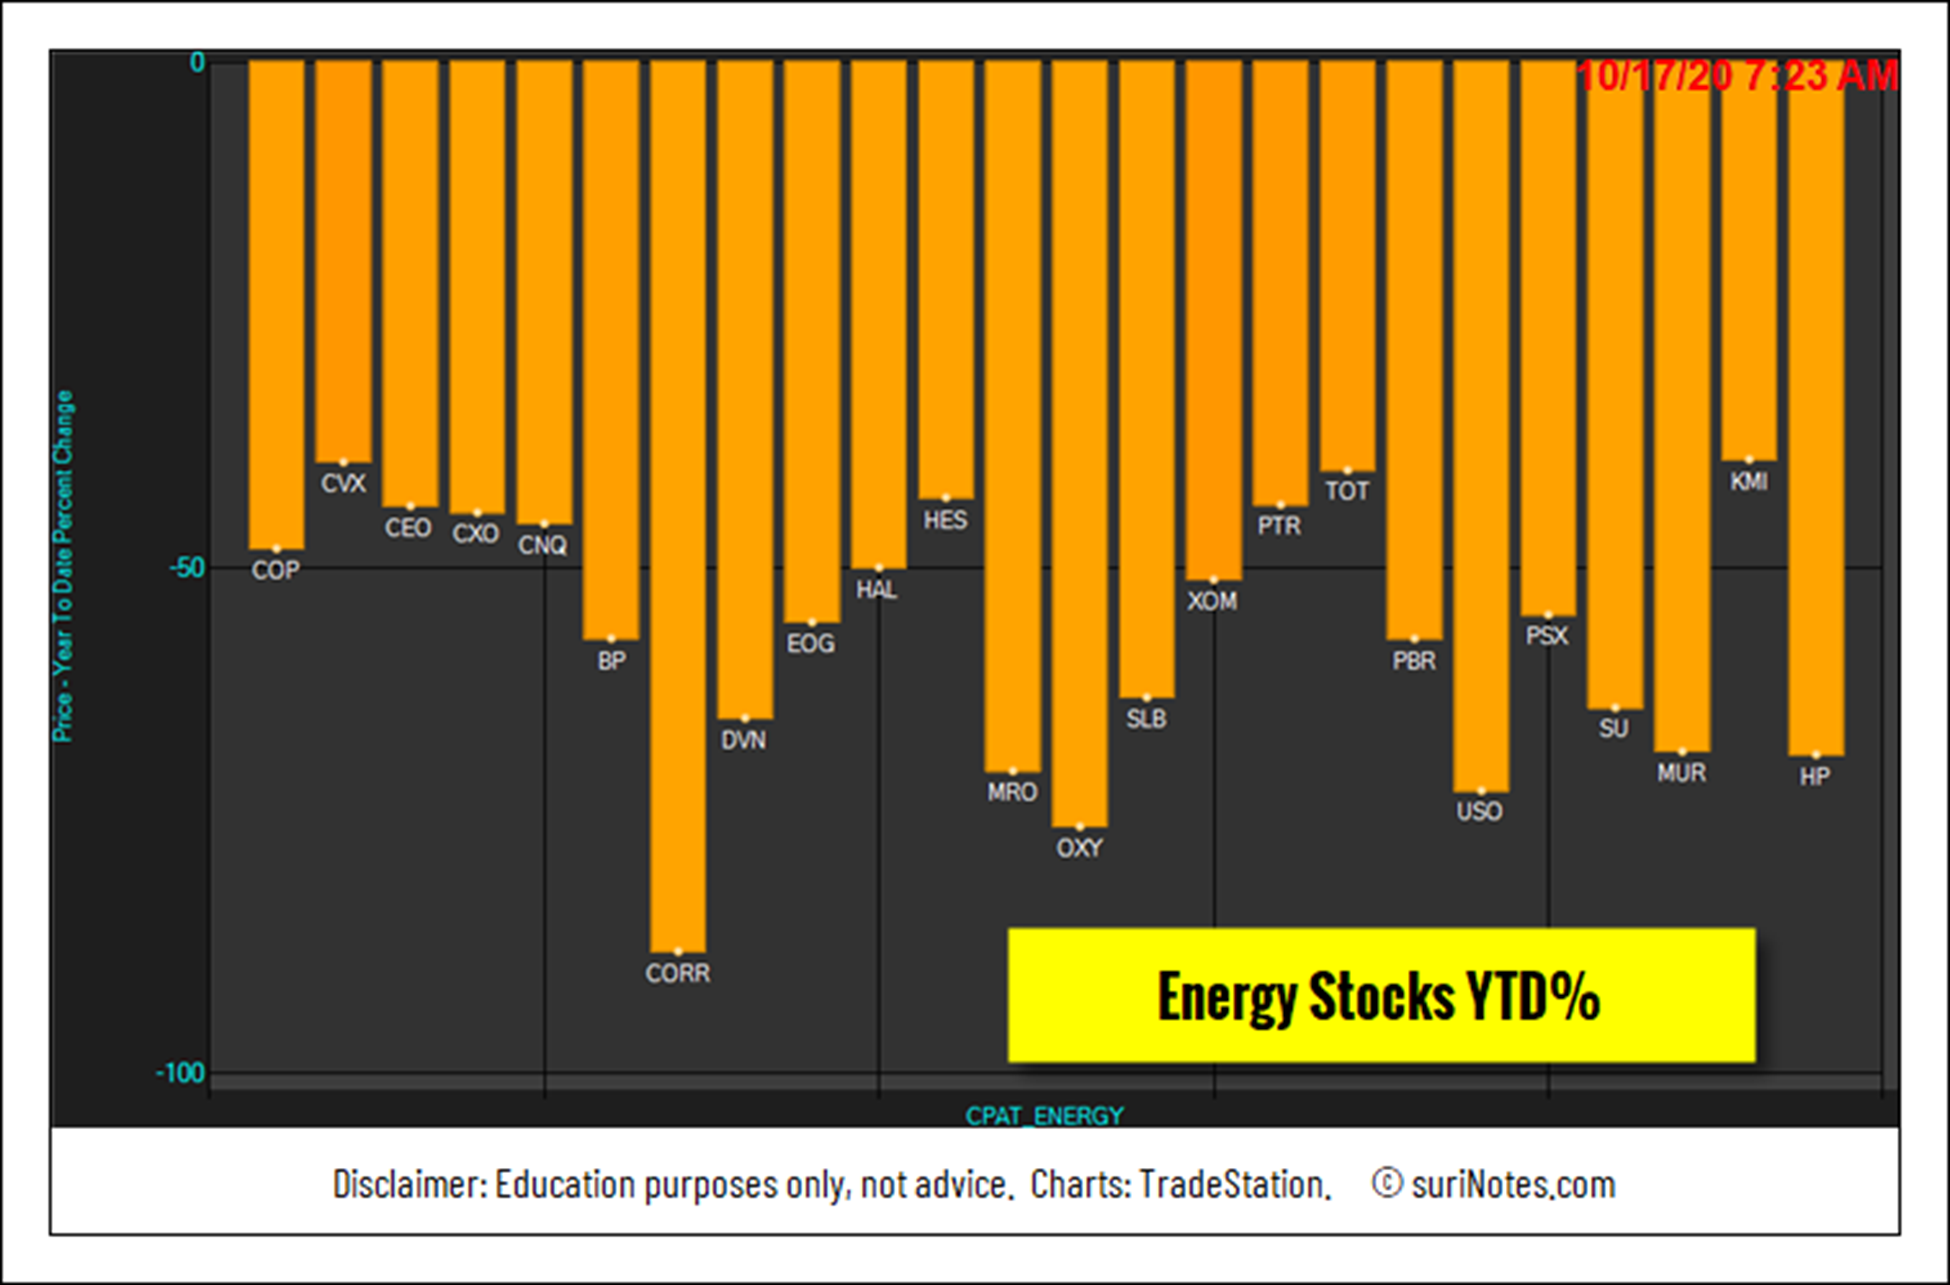
Energy Stocks Year-To-Date Performances
Harmonic Patterns
H.M. Gartley laid the harmonic patterns foundation and trading concepts in 1932. The primary theory behind harmonic patterns is price/time movements, which adhere to Fibonacci ratio relationships and its symmetry in markets. Fibonacci ratio analysis works well with any markets and on any time-frame charts. The basic idea of using these ratios is to identify key turning points, retracements, and extensions along with a series of the swing high and the swing low points. The derived projections and retracements using these swing points (highs and lows) will give key price levels for targets or stops. Scott Carney invented patterns like crab, bat, shark, 5-0, and added real-depth of knowledge for their trading rules, validity, and risk/money management.
Harmonic patterns construct geometric pattern structures (retracement and projection swings/legs) using Fibonacci sequences. These harmonic structures identified as specified (harmonic) patterns provide unique opportunities for traders with potential price movements and key turning or trend reversal points. This factor adds an edge for traders as harmonic patterns attempt to provide highly trustful price entries, stops, and targets information.
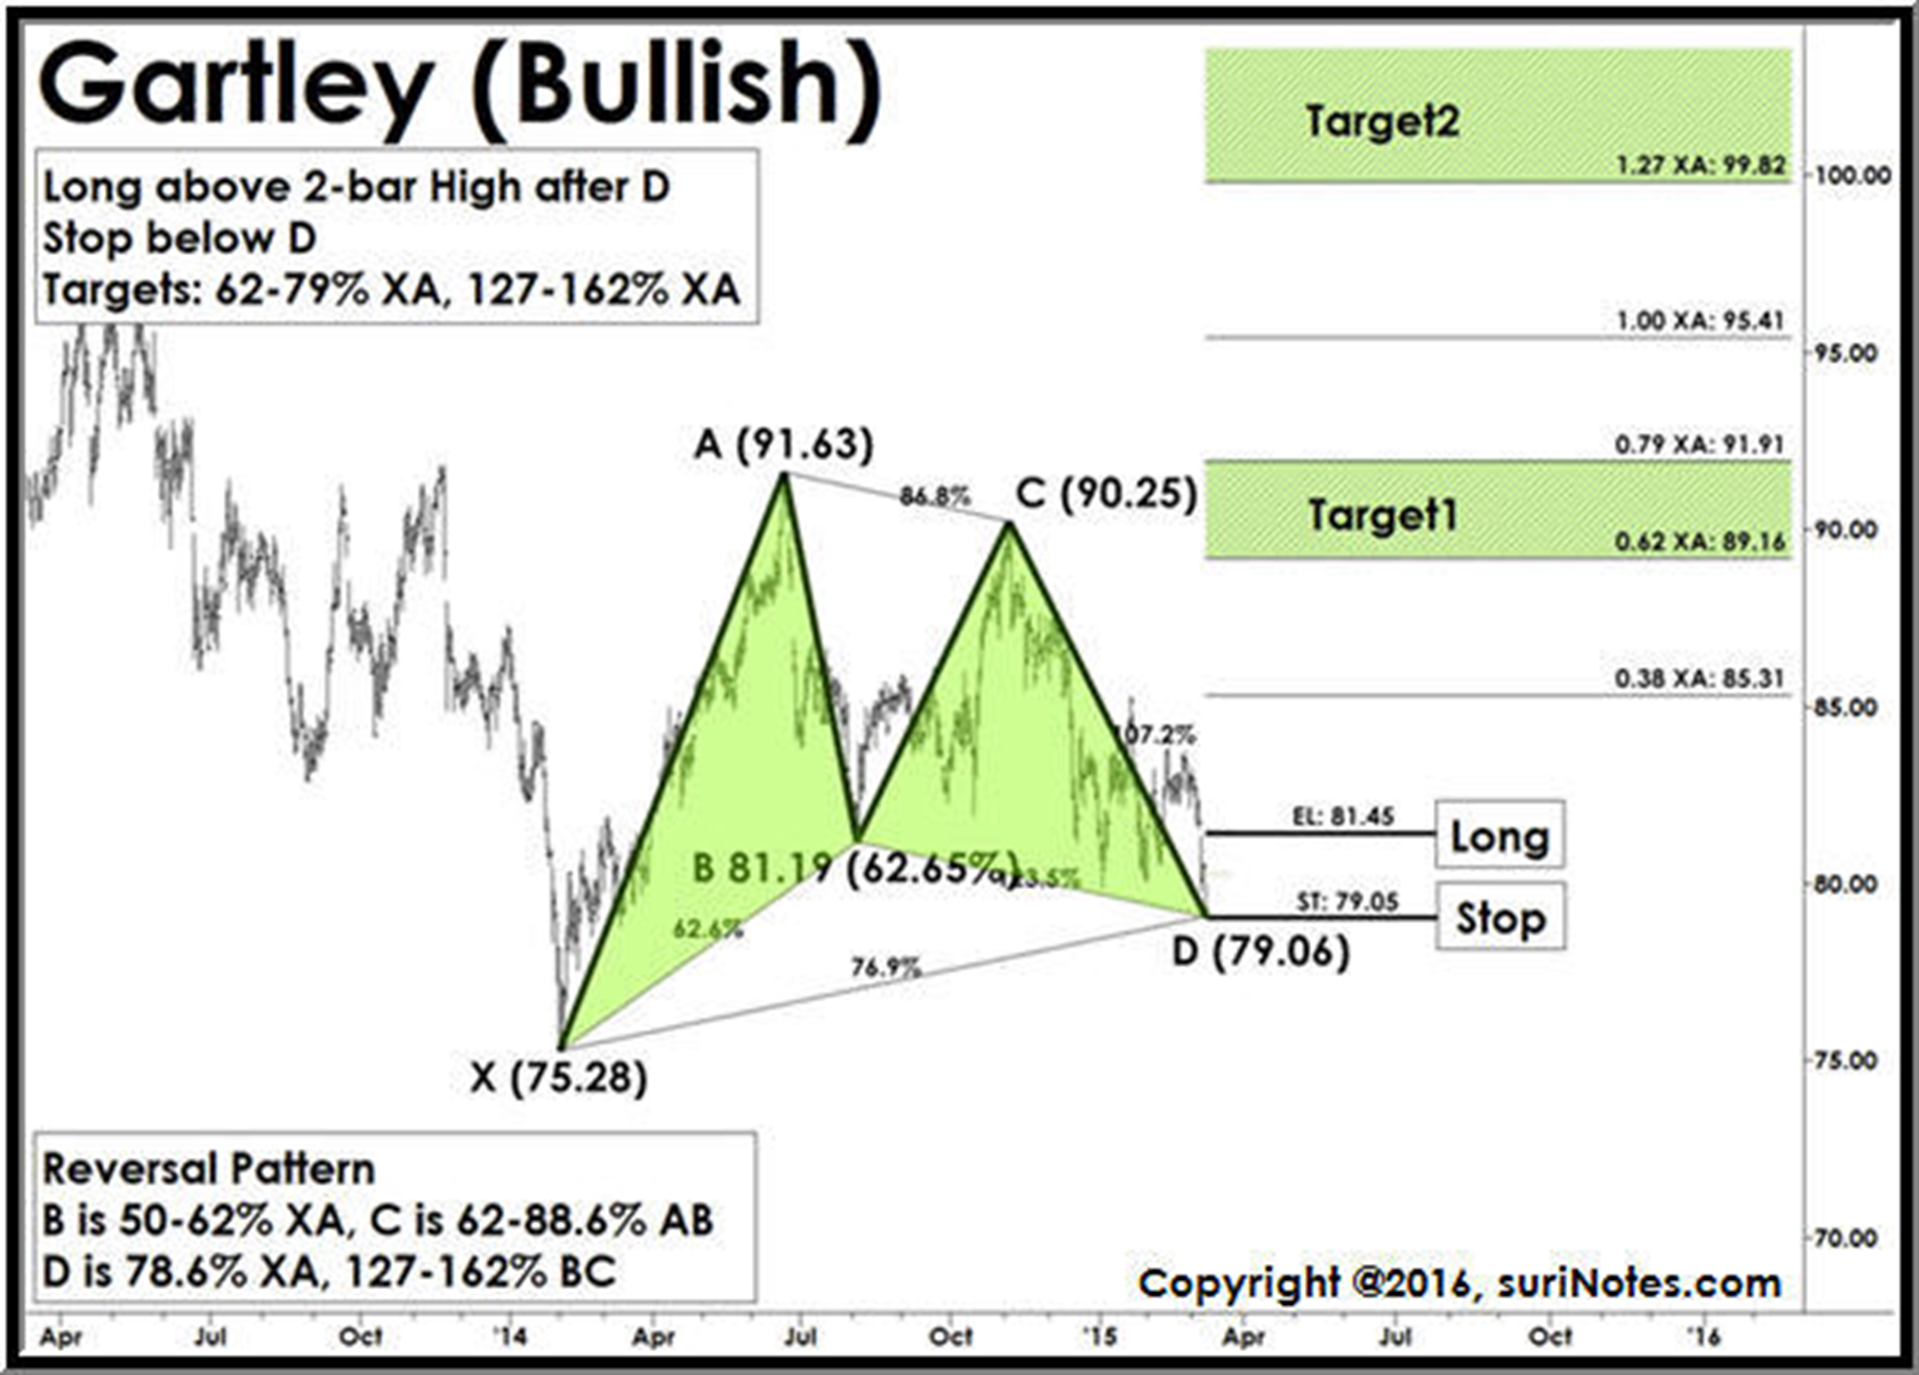
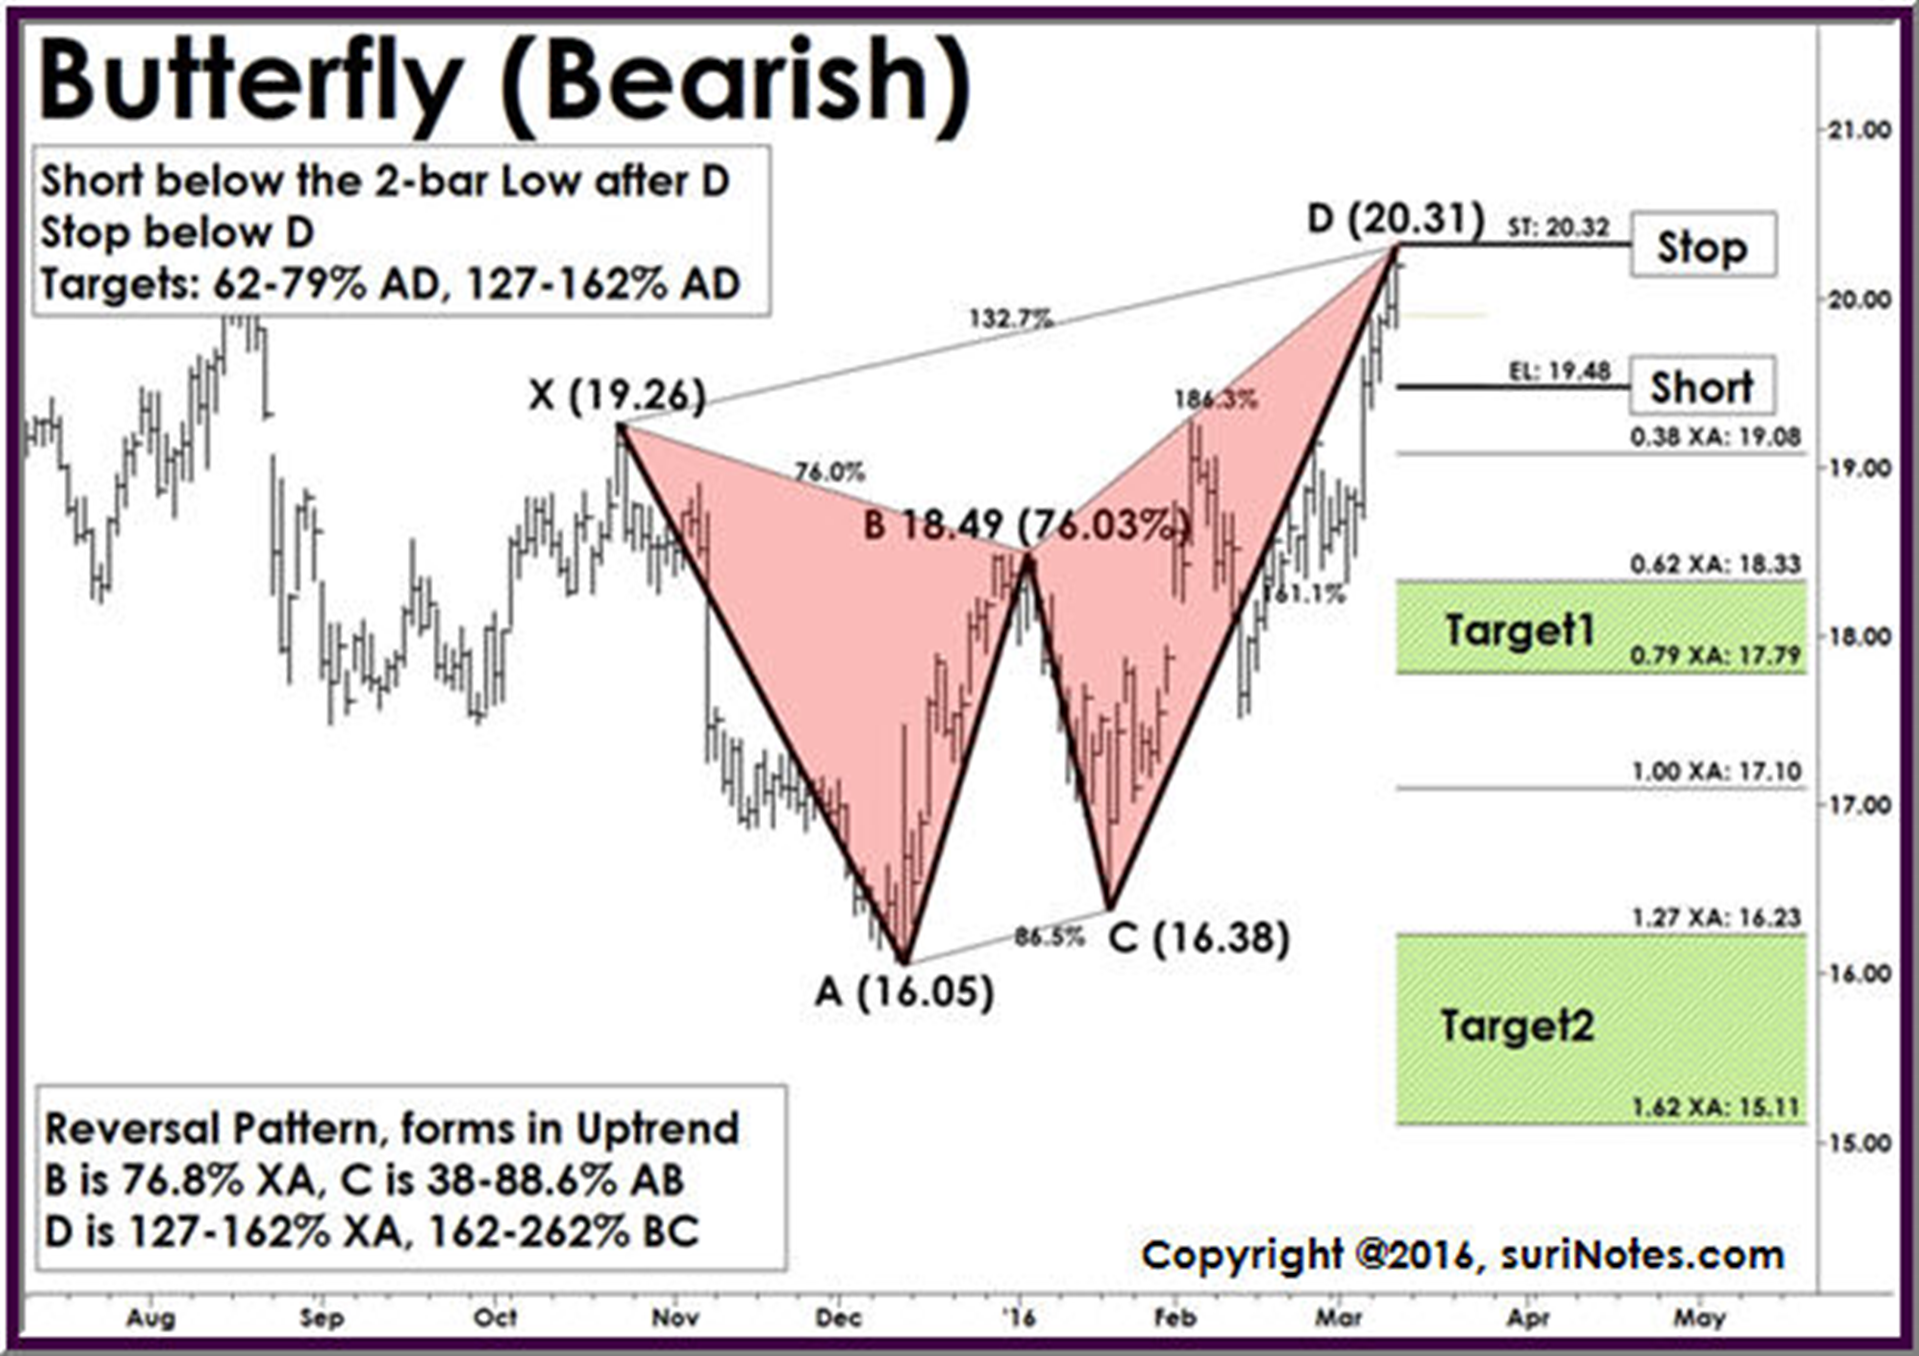
The following charts show how to trade harmonic (Gartley and Butterfly) chart patterns.
Harmonic Chart Patterns in Energy Stocks
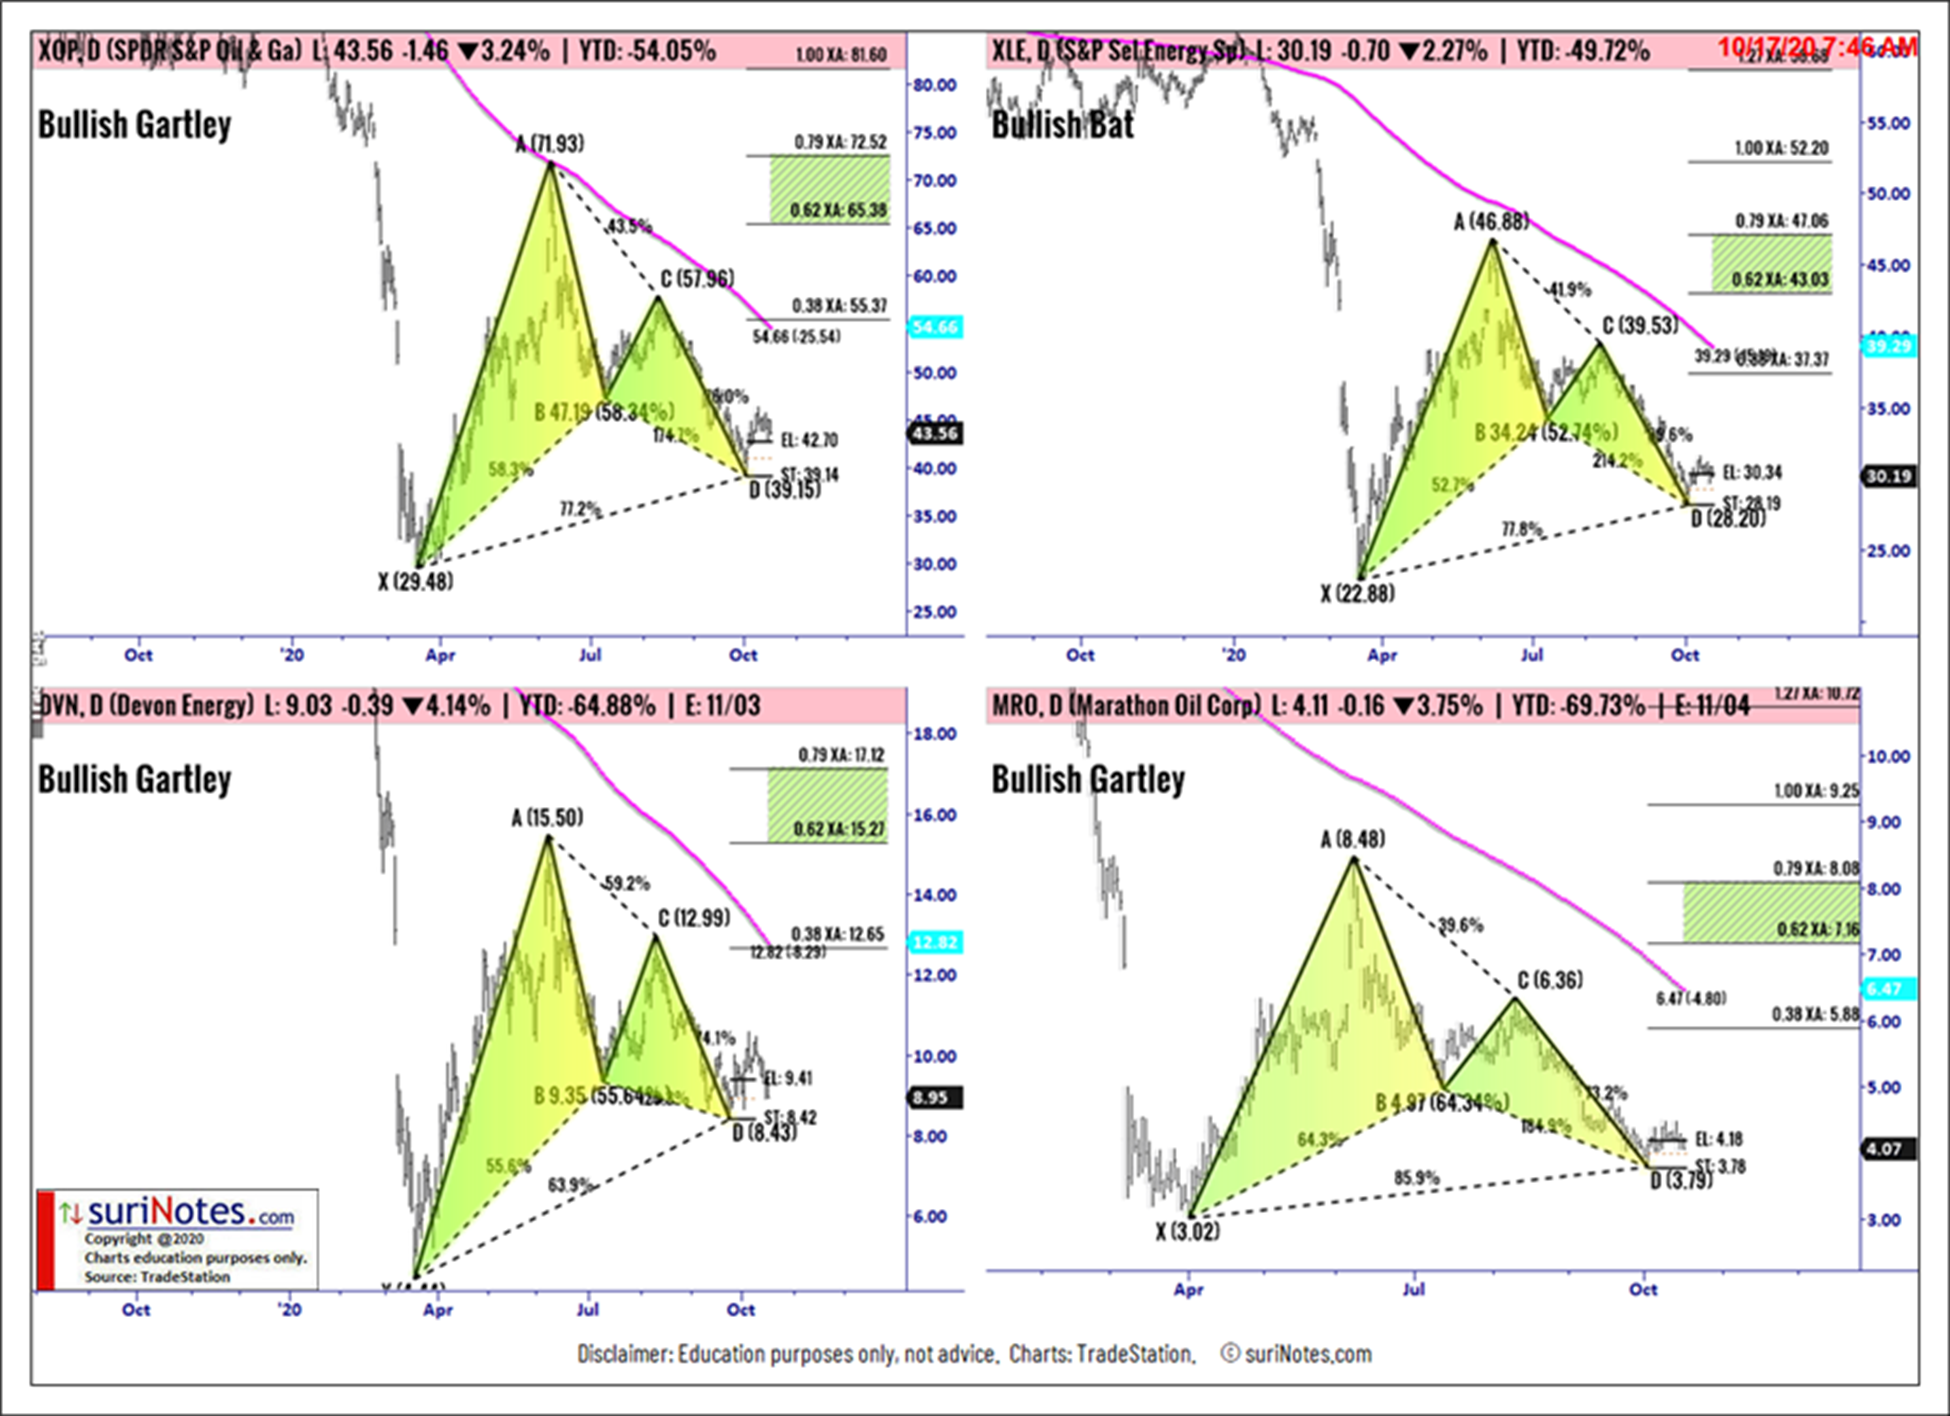
The following charts show various harmonic patterns in energy stocks.
XOP: XOP is trading in bullish Gartley pattern. Entry: 42.70, Stop: 39.14 (3.56) Target1: 65.47 to 72.69.
XLE: XLE daily chart is trading in bullish bat pattern. Entry: 30.34, Stop: 28.19 (2.15) Target1: 43.08 to 47.16.
DVN: DVN daily chart is trading in bullish Gartley pattern. Entry: 9.41, Stop: 8.42 (0.99) Target1: 15.29 to 17.17.
MRO: MRO Daily chart is trading in bullish Gartley pattern. Entry: 4.18, Stop: 3.78 (0.40) Target1: 7.18 to 8.10.
To learn more about Suri Duddella, please visit SuriNotes.com.


