
Moving average crossings are widely used for momentum investing and the golden cross (GC) is the most recognized crossing, states Joon Choi of Signal Alert Asset Management.
This occurs when the 50-day moving average crosses the 200-day moving average from below, signifying that further gains are likely in addition to serving as a buy signal. Conversely, the 50-day moving average dipping below the longer 200-day one is called a death cross (DC) and is viewed as a sell signal. In this article, I want to reveal a major sector that is on the brink of a golden cross and discuss whether it warrants increasing/initiating equity exposure in the sector.
Benefits and Drawbacks
The golden cross is very useful when there is a strong uptrend because it will keep you invested (i.e. 2009, 2013, and 2017). However, there are two major drawbacks. Firstly, it may generate bad buy/sell signals during a period when prices are not trended in either direction. Secondly, the crossings tend to generate a bad sell signal when there is a sharp correction after a prolonged rally (i.e. a S&P 500 Index death cross occurred after the index had already fallen 34% ) and a late buy signal when the price rebounds sharply (i.e. S&P 500 Index (SPX) golden cross after 42% rally from March lows).
Hope for financial sector?
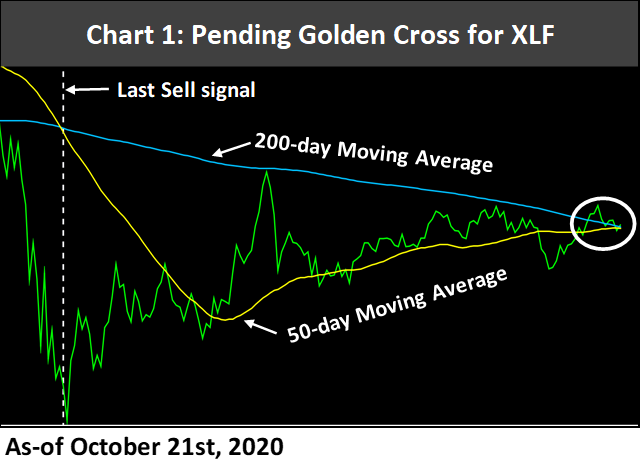
All the major S&P 500 sectors had the GC except for energy (XLE) and financial (XLF); they are the only two sectors with year-to-date losses (-47% and -18% respectively). However, XLF is on the verge of crossing and may only be days away (Chart 1). Note that the last sell signal (DC) was generated a day before its March low; it was a terrible signal. To make things worse, if the GC were to occur at the current level you would be buying 42% higher from the low.
Is GC/DC a viable strategy?
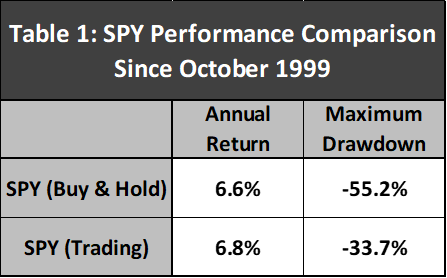
In my research I gathered daily price-only data for both XLF and SPY from December 22nd, 1998 (XLF’s launch date) and generated GC/DC signals for both vehicles. Then I used total return data to measure their performance figures (starting October 1999 due to using the first 200 data to create a 200-day moving average). For starters, trading SPY on the S&P 500 Index signals would have netted 0.2% outperformance and a 21.5% reduction on maximum drawdown versus simply buying and holding SPY (Table 1 below). Not bad but not great either because some years could have caused misery (i.e. trading SPY on GC/DC would have lagged SPY by 20% in 2020).
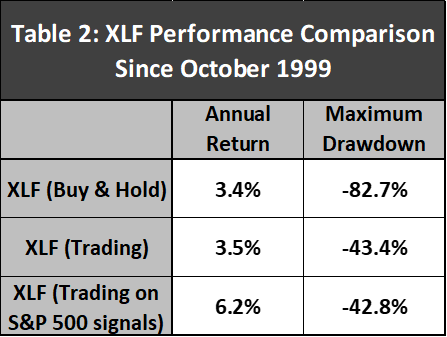
Trading XLF on its GC/DC also does not fare well as the strategy outperformed the buy & hold portfolio by 0.1% with 39.3% less drawdown. However, trading XLF on signals generated on the S&P 500 Index increased the annual return to 6.2% (almost doubling XLF’s return) with a 42.8% maximum drawdown (Table 2 below).
Digging Deeper
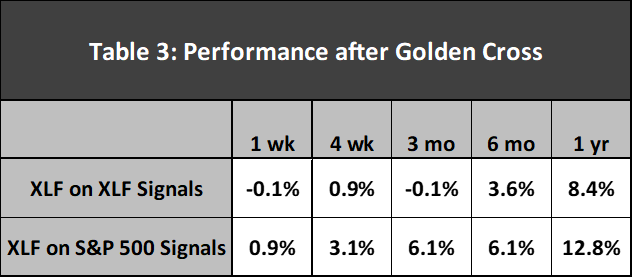
There were 12 round-trip trades trading XLF based on its price since 1999 and I calculated the average gains for five periods (1-week, 4-weeks, 3-month, 6-month, and 1-year) after the golden cross occurred. Table 3 shows that XLF was flat on average for the 1-week and 3-month periods but saw gains for 4-weeks, 6-month and 1-year; 0.9%, 3.6% and 8.4% respectively. What’s intriguing is that trading XLF on the S&P 500 Index signals led to all positive returns and improved performances for all five periods. Interestingly, SPX golden cross occurred on July 9 and XLF gained 11.9% in the three-month period since the buy (as of October 9), which is almost twice as much as the historical average of 6.1%.
Conclusion
Although GC/DC continues to garner attention within the investing community, this strategy fails to add value to portfolios as it barely improves returns (for both SPY and XLF); albeit significantly reducing maximum drawdowns. As a result, I recommend not acting on the impending golden cross for XLF; especially that XLF has historically been flat a month after the crossing. This statistic may be important because the election is less than two weeks away and we may see increased volatility after election results. Lastly, if you are interested in managing financial sector exposure, it may be prudent to pay attention to the GC/DC for the S&P 500 Index as XLF seems to trade very well on their signals. Please be advised that returns were improved but maximum risk was not curtailed. We employ a slightly modified GC/DC model that reduces the risk dramatically with minimal decrease in return. Don’t hesitate to contact me if you have any questions or want to discuss about your investment portfolio.
To learn more about Joon Choi, please visit Signal Alert Asset Management.


