
The E-mini on Monday broke far below the small wedge bull flag on the daily chart. It fell below the open of the month and the February high, but it reversed up and closed above both support levels, states Al Brooks of BrooksTradingCourse.com.
Also, it closed just above the midpoint of the day’s range, which makes the bear breakout less certain.
Yesterday was a bear bar on the daily chart. Traders see that as E-mini follow-through selling and confirmation of Monday’s bear breakout. It increases the chance of at least slightly lower prices today. Today will probably open with a big gap down. If today is another bear day, the E-mini will probably work down to the September low over the next few weeks.
Because yesterday was an inside day on the daily chart and it had a bear body, it is a Low 1 sell signal bar for today. The bears want a measured move down to the September low, and the bulls want the September rally to resume up to the all-time high.
This is all about the monthly chart
This week’s selloff has been all about the monthly chart. October is an inside bar on the monthly chart. If it ends up with a bear body, it will increase the chance of lower prices in November.
The open of the month might remain an important magnet for the rest of the month. But the bulls will need a reversal up today. Otherwise, the E-mini will be too far below the open for it to get back above the open by Friday’s close.
If the E-mini is within 20 points of the open of the month in the final hour on Friday, the E-mini will probably get drawn to it. Then, in the final minutes of trading for the month, either close a little above or below the open of the month.
While the odds of lower prices are increasing, the bulls still have a chance of reversing the bear breakout. But they need to start forming bull bars.
Overnight Emini Globex trading
The E-mini is down 65 points in the Globex session. It will therefore open with a big gap down. A big gap increases the chance of a trend day. A bear trend is slightly more likely.
But the Emini will open far below the 20-bar EMA on the 5-minute chart, which is a measure of the average price. Day traders do not like to sell far below the average price unless the selling is far above average. They would need to see a couple consecutive big bear bars in the 1st 30 minutes before they will sell. The bulls want to see a couple big bull bars before buying and betting on a bull trend.
When there is a big gap down, there is only a 20% chance of a big trend up or down on the open. There is an 80% chance that the first leg up or down will lead to a trading range. The bulls will look to buy a double bottom or wedge bottom for a swing up. The bears want a double top or wedge top near the EMA before selling for a swing down.
Also, if there is a trading range open and then a trend, the trend usually will not last all day. It typically either evolves into a trading range for at least a couple hours or has at least a small reversal late in the day.
Yesterday’s setups
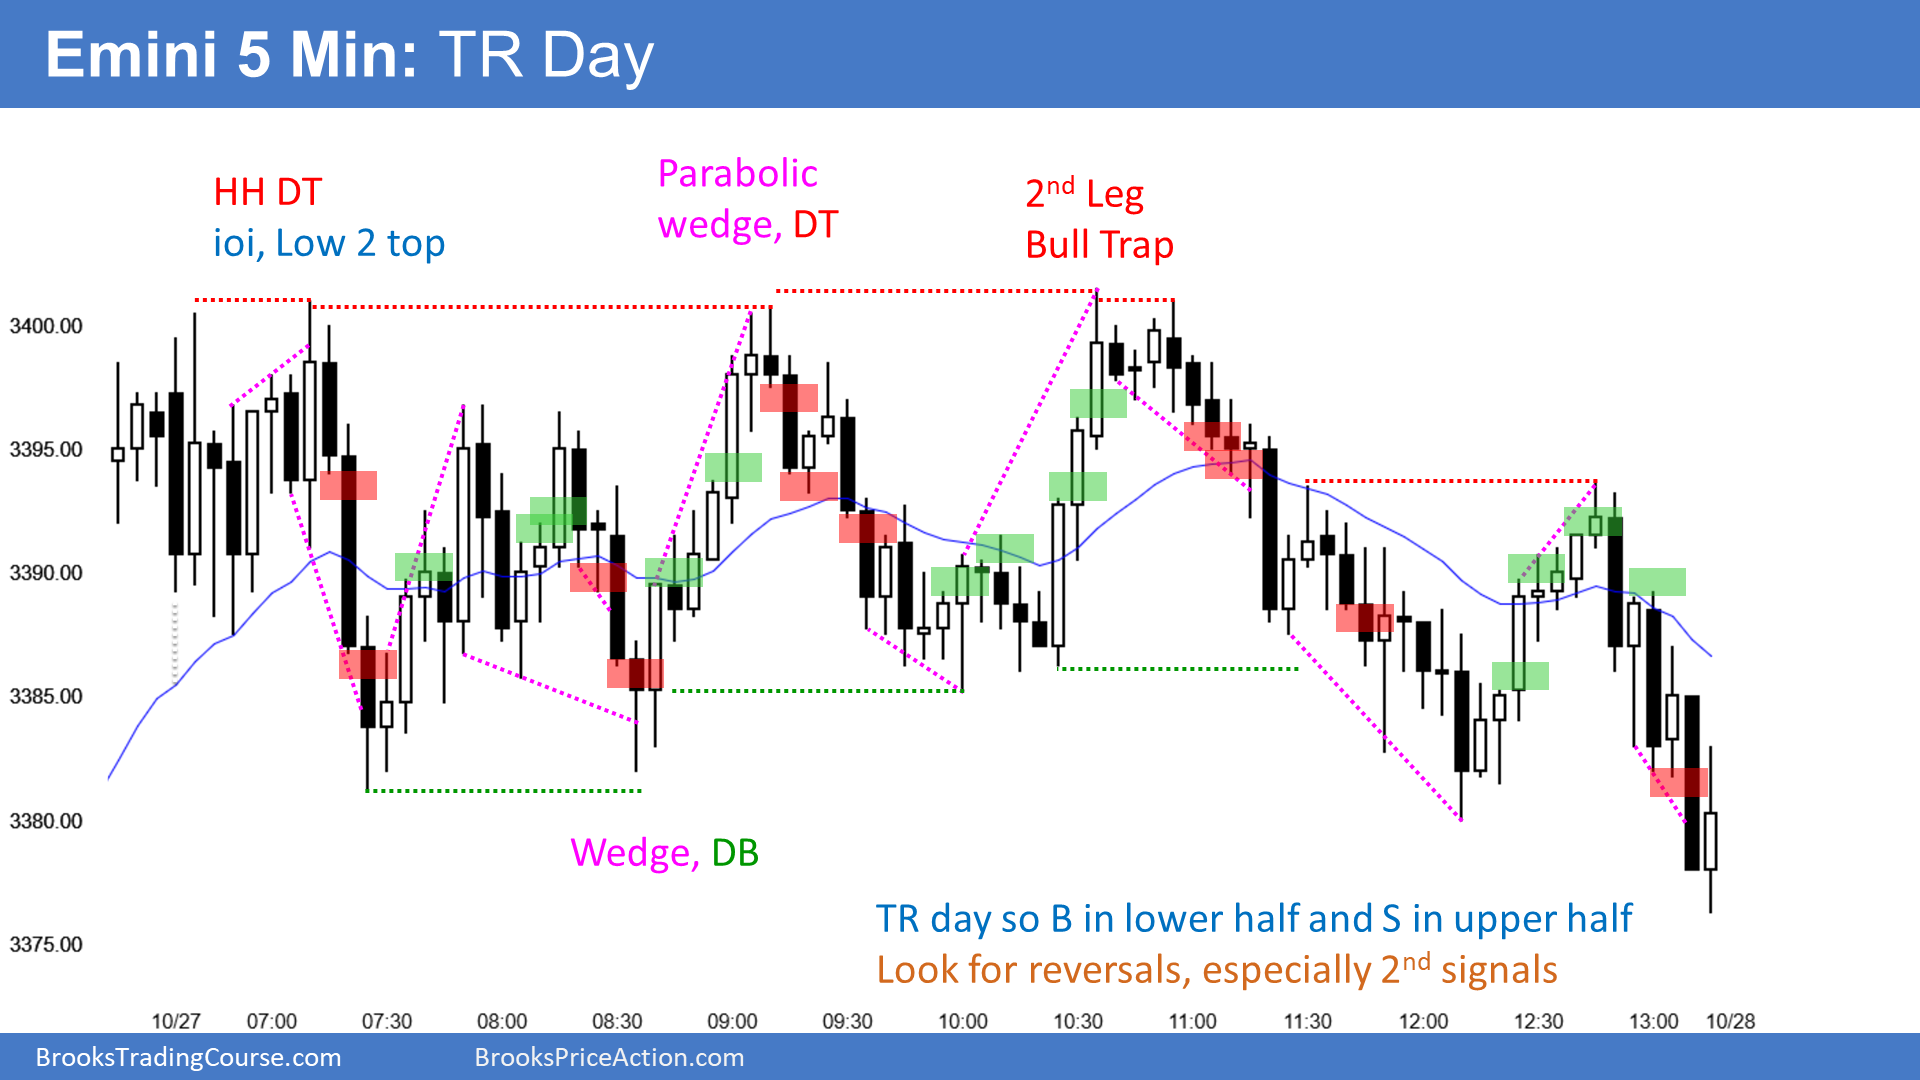
Here are several reasonable stop entry setups from yesterday. I show each buy entry with a green rectangle and each sell entry with a red rectangle. I rarely also show limit order entries and entries on the close of bars. I do not want the lines to be distracting. If they are longer, I make them dotted. But, they have to be visible, so I make the shorter ones solid. Buyers of both the Brooks Trading Course and Encyclopedia of Chart Patterns have access to a much more detailed explanation of the swing trades for each day (see Online Course/BTC Daily Setups).
My goal with these charts is to present an Always In perspective. If a trader was trying to be Always In or nearly Always In a position all day, and he was not currently in the market, these entries would be logical times for him to enter.
If the risk is too big for your account, you should wait for trades with less risk or trade an alternative market like the Micro E-mini.
EUR/USDfForex market trading strategies
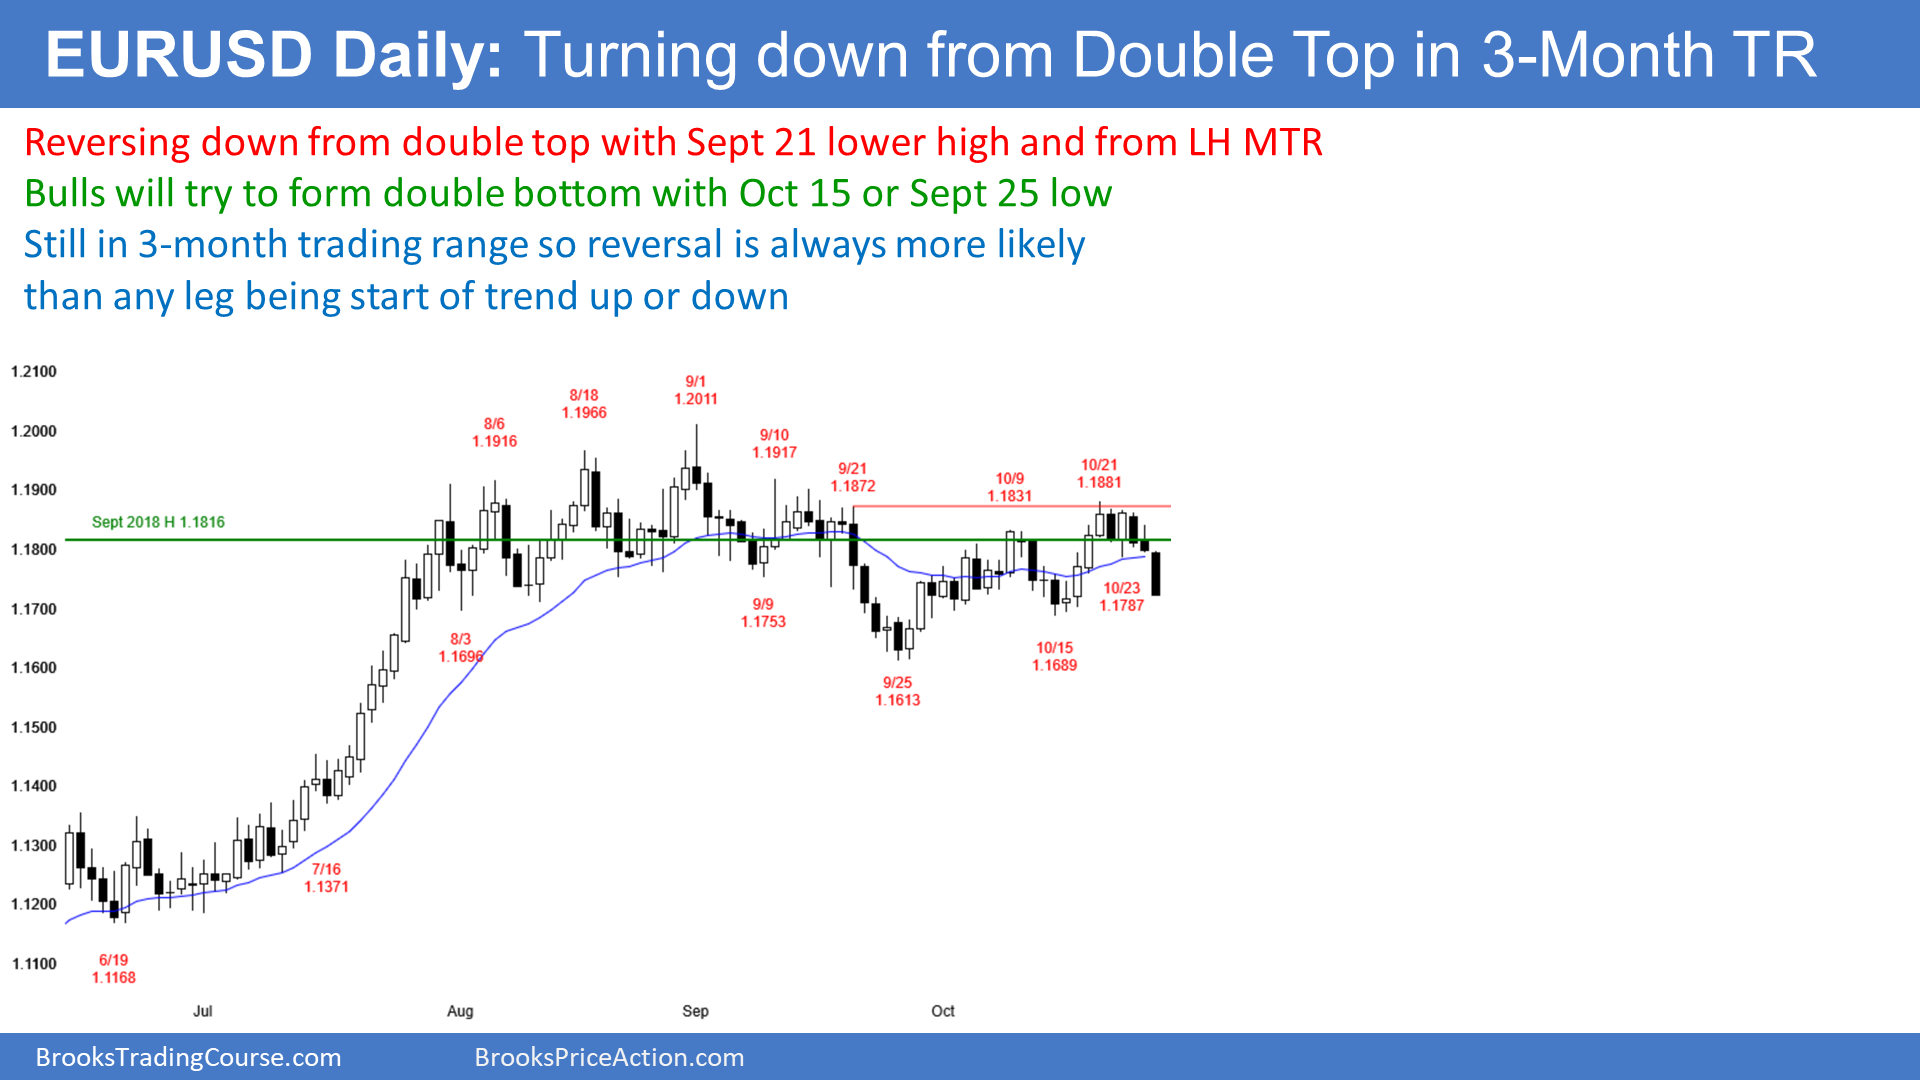
The EUR/USD forex market on the daily chart is turning down from a double top lower high major trend reversal. If today closes on its low, the EUR/USD should fall at least to the October 15 low. The bulls will try to form a double bottom with that low or with the September 25 low.
I said last week at the top of the rally that reversals were more likely than breakouts. That is true on the way down as well. But if today remains a big bear day, it will probably be the start of a selloff that will last at least another week.
Also, it should have at least a second leg down. Legs in trading ranges often have two legs, like the rally to the September 1 high, the selloff to the September 25 low, and the rally to the October 21 high.
The weekly chart is important. Despite the three-month trading range, there was a four-month wedge top. Today could be the start of a second leg down from that wedge top. If it is, the 1st target is the March 9 high, which was the breakout point for the summer rally.
Overnight EUR/USD Forex trading
The 5-minute chart of the EUR/USD forex market has sold off in a small pullback bear trend overnight. That is a strong bear trend. Day traders have only been selling.
However, the day’s range is big, and the selloff is beginning to have a wedge shape. That typically will attract profit takers. If so, the bear trend will begin to transition into a trading range for at least a couple hours.
But until there is at least a 20-pip bounce, day traders will only sell. Once there is a 20-pip bounce, day traders will also begin to buy reversals up from 10 to 20-pip scalps.
The bulls want a trend reversal up. They will probably not get one today. If they do, they will have to stop the selling and enter a trading range for at least a couple hours first.
Summary of today’s S&P Emini futures price action and what to expect tomorrow
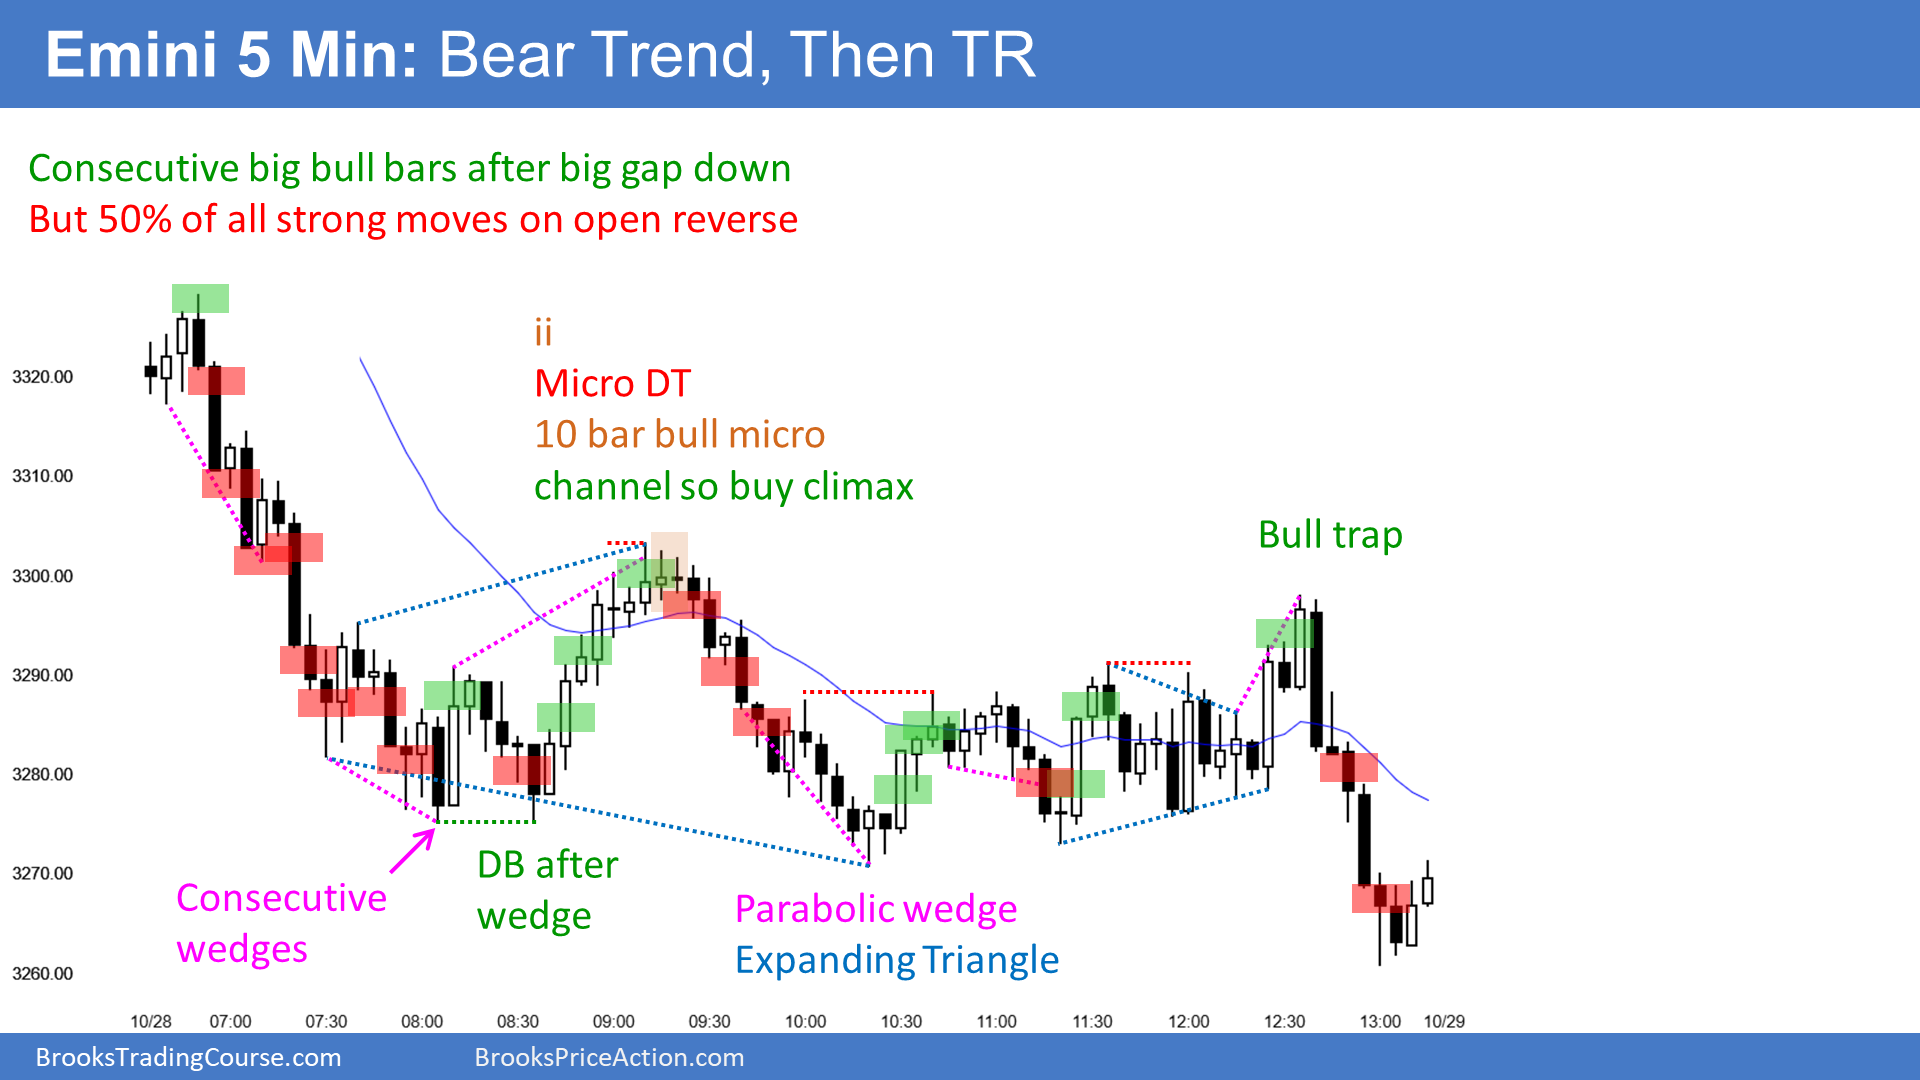
Here are several reasonable stop entry setups for today. I show each buy entry with a green rectangle and each sell entry with a red rectangle. I rarely also show limit order entries and entries on the close of bars. I do not want the lines to be distracting. If they are longer, I make them dotted. But, they have to be visible, so I make the shorter ones solid.
My goal with these charts is to present an Always In perspective. If a trader was trying to be always in or nearly always in a position all day, and he was not currently in the market, these entries would be logical times for him to enter.
If the risk is too big for your account, you should wait for trades with less risk or trade an alternative market like the Micro E-mini.
Learn more about Al Brooks at Brooks Trading Course.


