
The E-mini yesterday reversed down from a new all-time high and closed below the September all-time high. It did not close at a new all-time high, states Al Brooks of BrooksTradingCourse.com.
The selloff fell to below last week’s high. That closed the gap on the weekly chart. But gaps are minor patterns. A closed gap in a bull trend is not important. Look at the weekly chart this summer. There was a strong rally, even though there were three gap ups that closed before the week ended.
Traders are deciding if Monday was a failed breakout of the four-month trading range or just the start of a brief pullback. Unless the bears get more big bear bars, traders expect higher prices.
The seven-day rally was extreme, as was Monday’s reversal down. Big up, big down creates big confusion, and confusion usually results in at least a small trading range. Therefore, the E-mini might have to go sideways for another day or two, and possibly longer, before the bulls will buy for another leg up.
Yesterday is a high 1 bull flag buy signal bar for today. But it was not a big bull bar closing on its high, and it followed a big bear bar. This is therefore a weak high 1 buy signal. The E-mini might go more sideways than up for a few days. Also, with the bond market closed today, there will be less financial information. This will take away one force that could lead to a trend.
The E-mini is up 25 points in the Globex session. It will probably gap above yesterday’s high. That would trigger a buy signal on the daily chart.
But with yesterday being only a small bull day and Monday being a big bear day, this is not a strong buy setup. That reduces the chance of today being a big bull day. Also, yesterday had a lot of trading-range trading, and the bond market is closed today. These factors increase the chance of more trading-range trading today.
I mentioned that Monday broke to a new all-time high but closed below the September high. Today will open around the September high. That high could be a magnet today. The bulls want the two-week rally to close at a new high today.
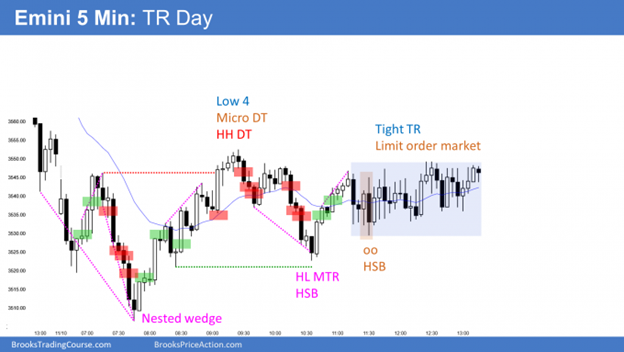
Here are several reasonable stop entry setups from yesterday. I show each buy entry with a green rectangle and each sell entry with a red rectangle. I rarely also show limit order entries and entries on the close of bars. I do not want the lines to be distracting. If they are longer, I make them dotted. But they have to be visible, so I make the shorter ones solid. Buyers of both the Brooks Trading Course and Encyclopedia of Chart Patterns have access to a much more detailed explanation of the swing trades for each day (see Online Course/BTC Daily Setups).
My goal with these charts is to present an always in perspective. If a trader was trying to be always in or nearly always in a position all day, and he was not currently in the market, these entries would be logical times for him to enter.
If the risk is too big for your account, you should wait for trades with less risk or trade an alternative market like the micro E-mini.
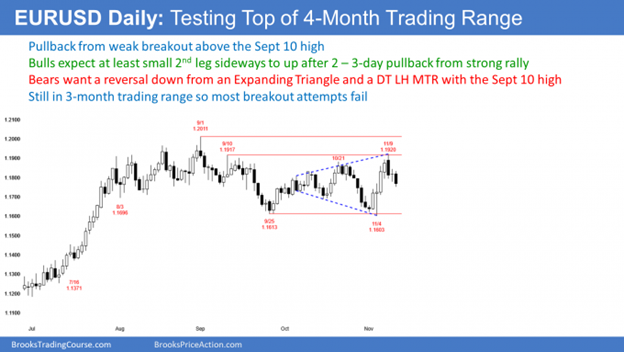
The EUR/USD forex market on the daily chart has been in a trading range for four months. There have been many strong legs up and down, but each has led to a reversal instead of a trend.
It is now turning down from a double top lower high and expanding triangle with the September 10 high. The bears want a test of the bottom of the range and then a breakout below the range. The bulls believe that last week’s rally was strong enough to have at least a small second leg sideways to up. But they need this selloff to stop today or tomorrow and reverse back up.
This is the decision that traders repeatedly make in a trading range. Is a reversal simply a pullback from a strong leg that will lead to at least a small second leg? Or will the pullback grow into a reversal that will test the opposite side of the range?
If the bears get one more bear day tomorrow, the odds will shift in favor of a reversal down to the November low. But if today or tomorrow reverses back up, traders will continue to expect a test of Monday’s high.
The five-minute chart of the EUR/USD forex market sold off strongly overnight. But the selloff has been in a parabolic wedge and it is climactic. That typically will attract profit takers, which usually will end the bear trend and begin a trading range or a reversal.
So far, day traders have only been selling for swing trades. But the selling should soon attract profit-taking.
If there is one more new low and then another reversal, the sell climax will have three legs. Traders will then look to buy a reversal up. If there is a reversal up from a strong bear trend, it usually will lead to a trading range for 20 or more bars. At that point, the bulls will have a better chance of a reversal up into a trend.
At the moment, traders expect a minor new low and then profit-taking. That should lead to a trading range, possibly for the remainder of the day. If so, day traders will switch to scalping longs and shorts.
Can the collapse continue all day? When the selloff looks like this, it usually attracts profit-taking and converts into a trading range.
Learn more about Al Brooks at Brooks Trading Course.


