
Breakaway gaps occur when prices rise out of congestion zones or long-base trading areas to signal a potential emerging trend. When growth stocks break away from long bases, they show their sentiment change from bearish to bullish or vice-versa, states Suri Duddella of suriNotes.com.
The breakaway gaps are most reliable and are easy to detect visually. Breakway gaps usually form in the beginning phases of a trend and show a great potential for a significant move up or move down in the direction of the gap. These gaps usually accompanied by heavy volume on the breakout and produce strong gains in just a few months of trading, and also, they do not tend to close gaps quickly.
How to Trade Breakaway Gaps
- Enter a trade above the breakaway gap bar's high.
- Place a stop below the low of the bar prior to the gap.
- Targets are usually set on a previous major swing high or significant unfilled gaps in the direction of the gap.
Breakaway Gap Examples
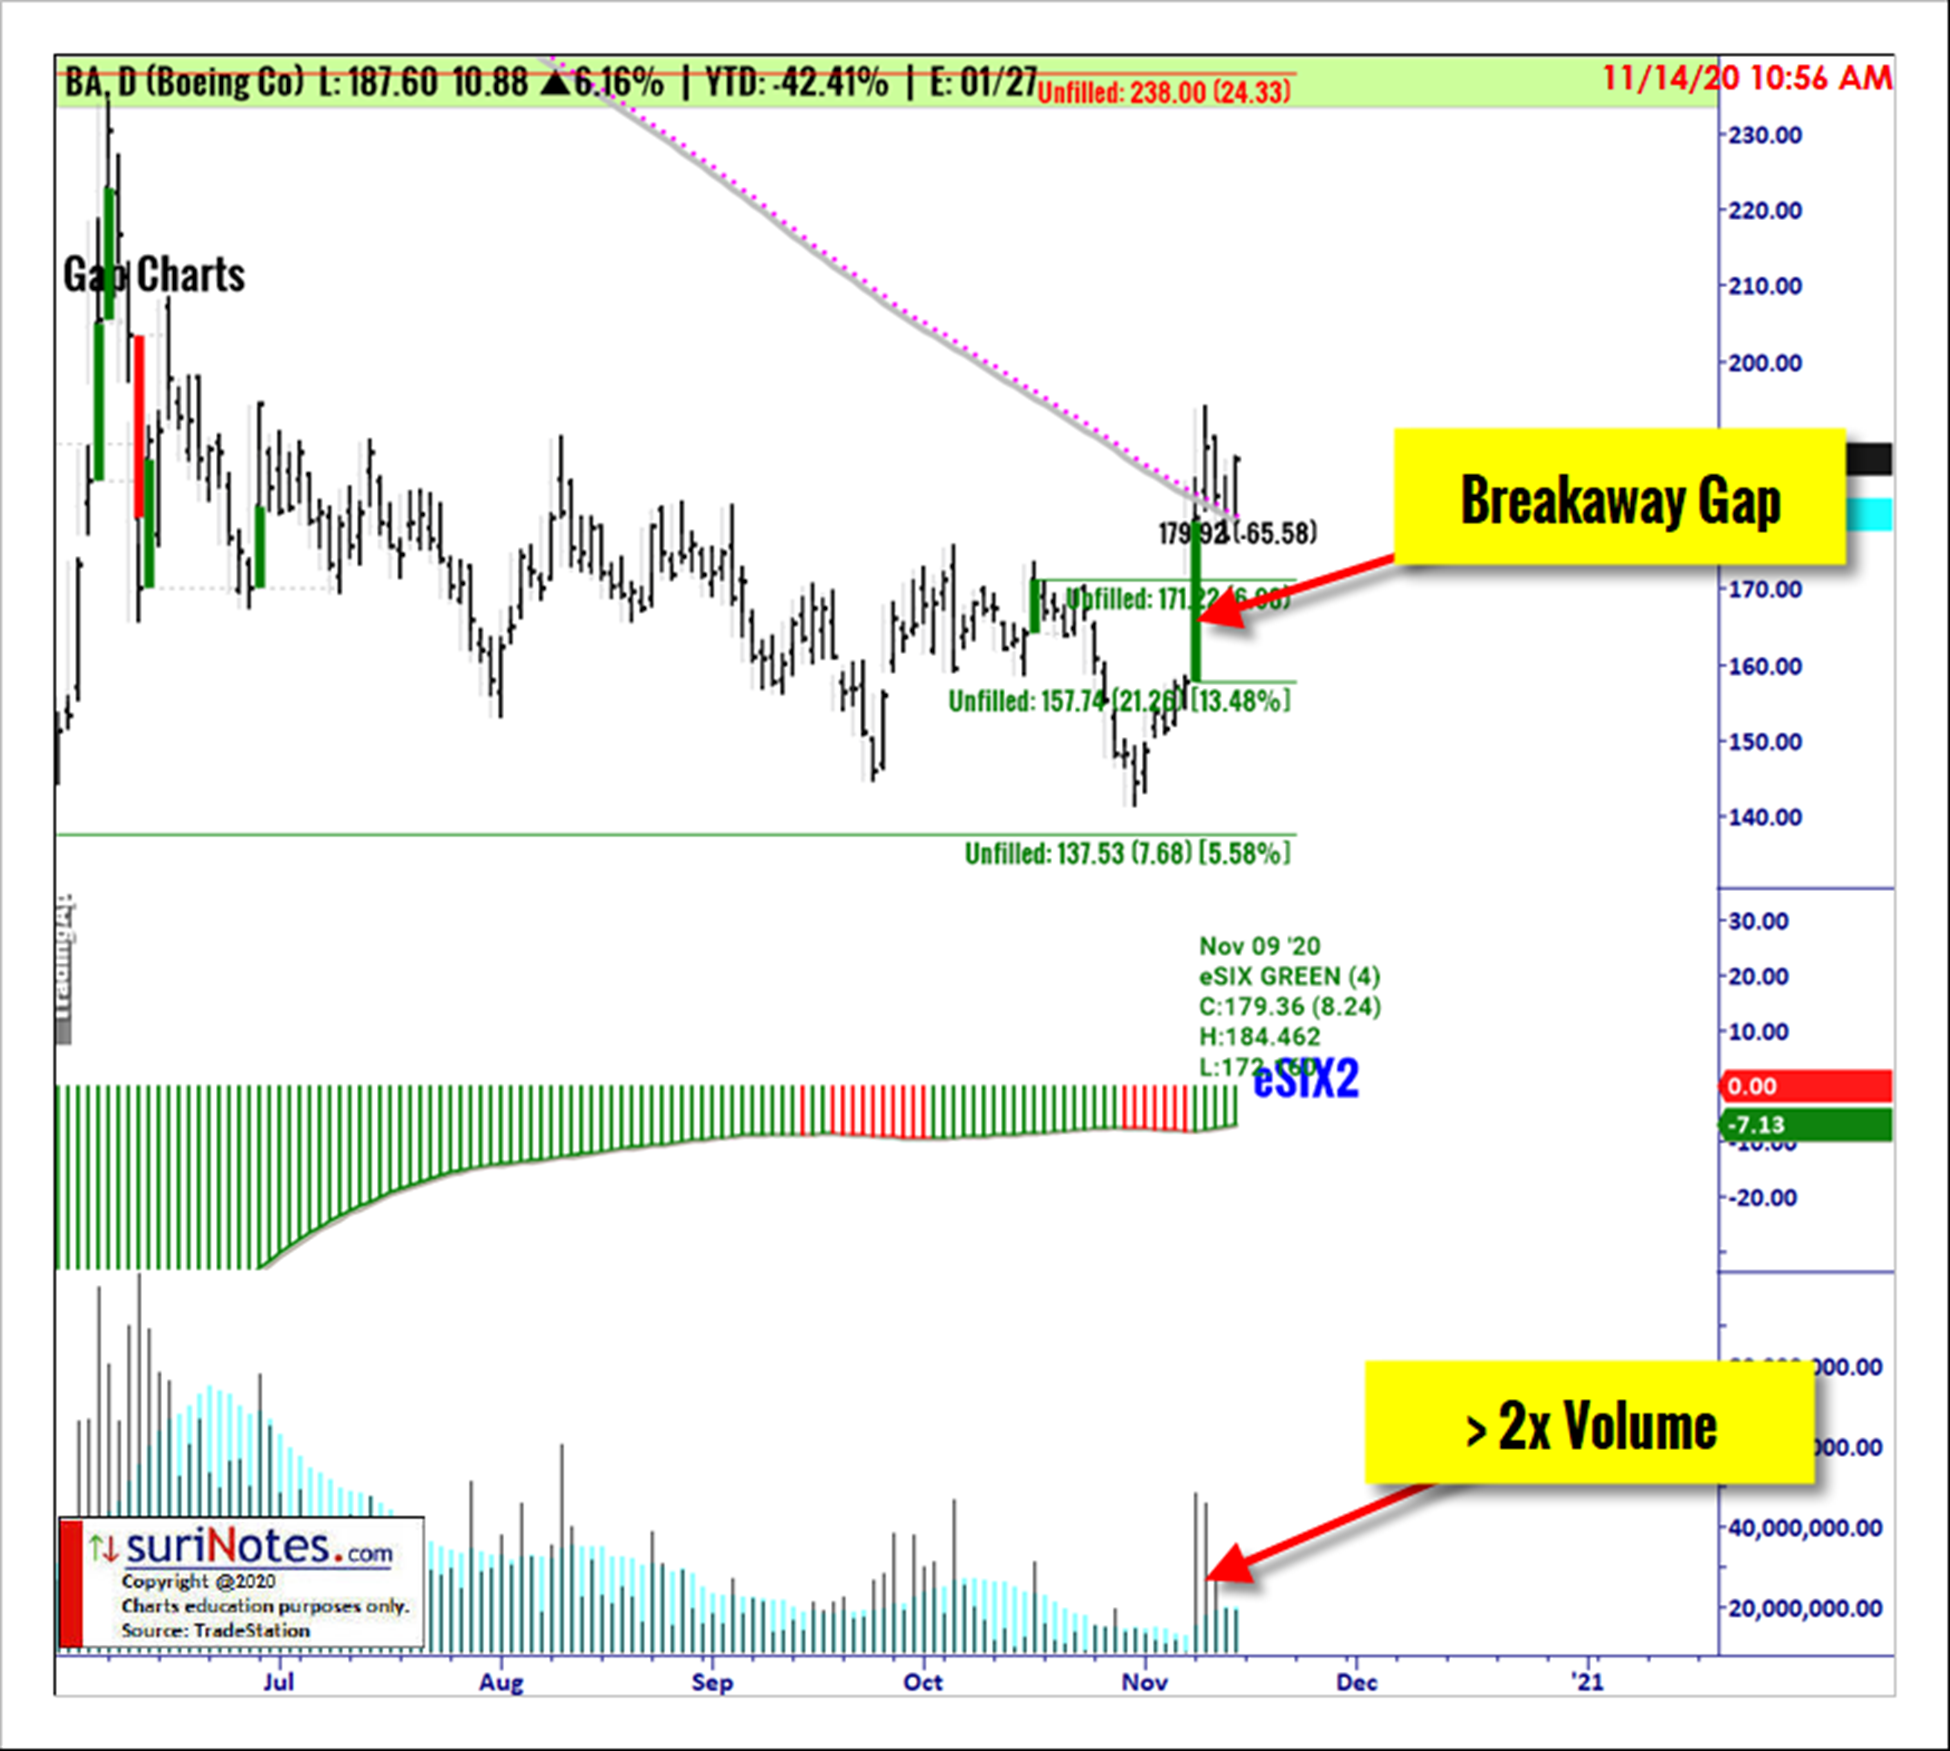
Boeing Co. (BA)
The following daily chart of Boeing Co. shows a long-base formation from a low of $140 to $175 in June 2020 to November 2020. On 11/09/2020, BA rallied from a previous close of $157.74 to an open of $179.00 (Gap Up: $21.26 Gap Perc%: 13.48%) breaking above the previous trading range with increased volume. BA may continue its breakaway gap up rally towards the next unfilled gap levels at $238 and $262. A stop is placed below $154.52.
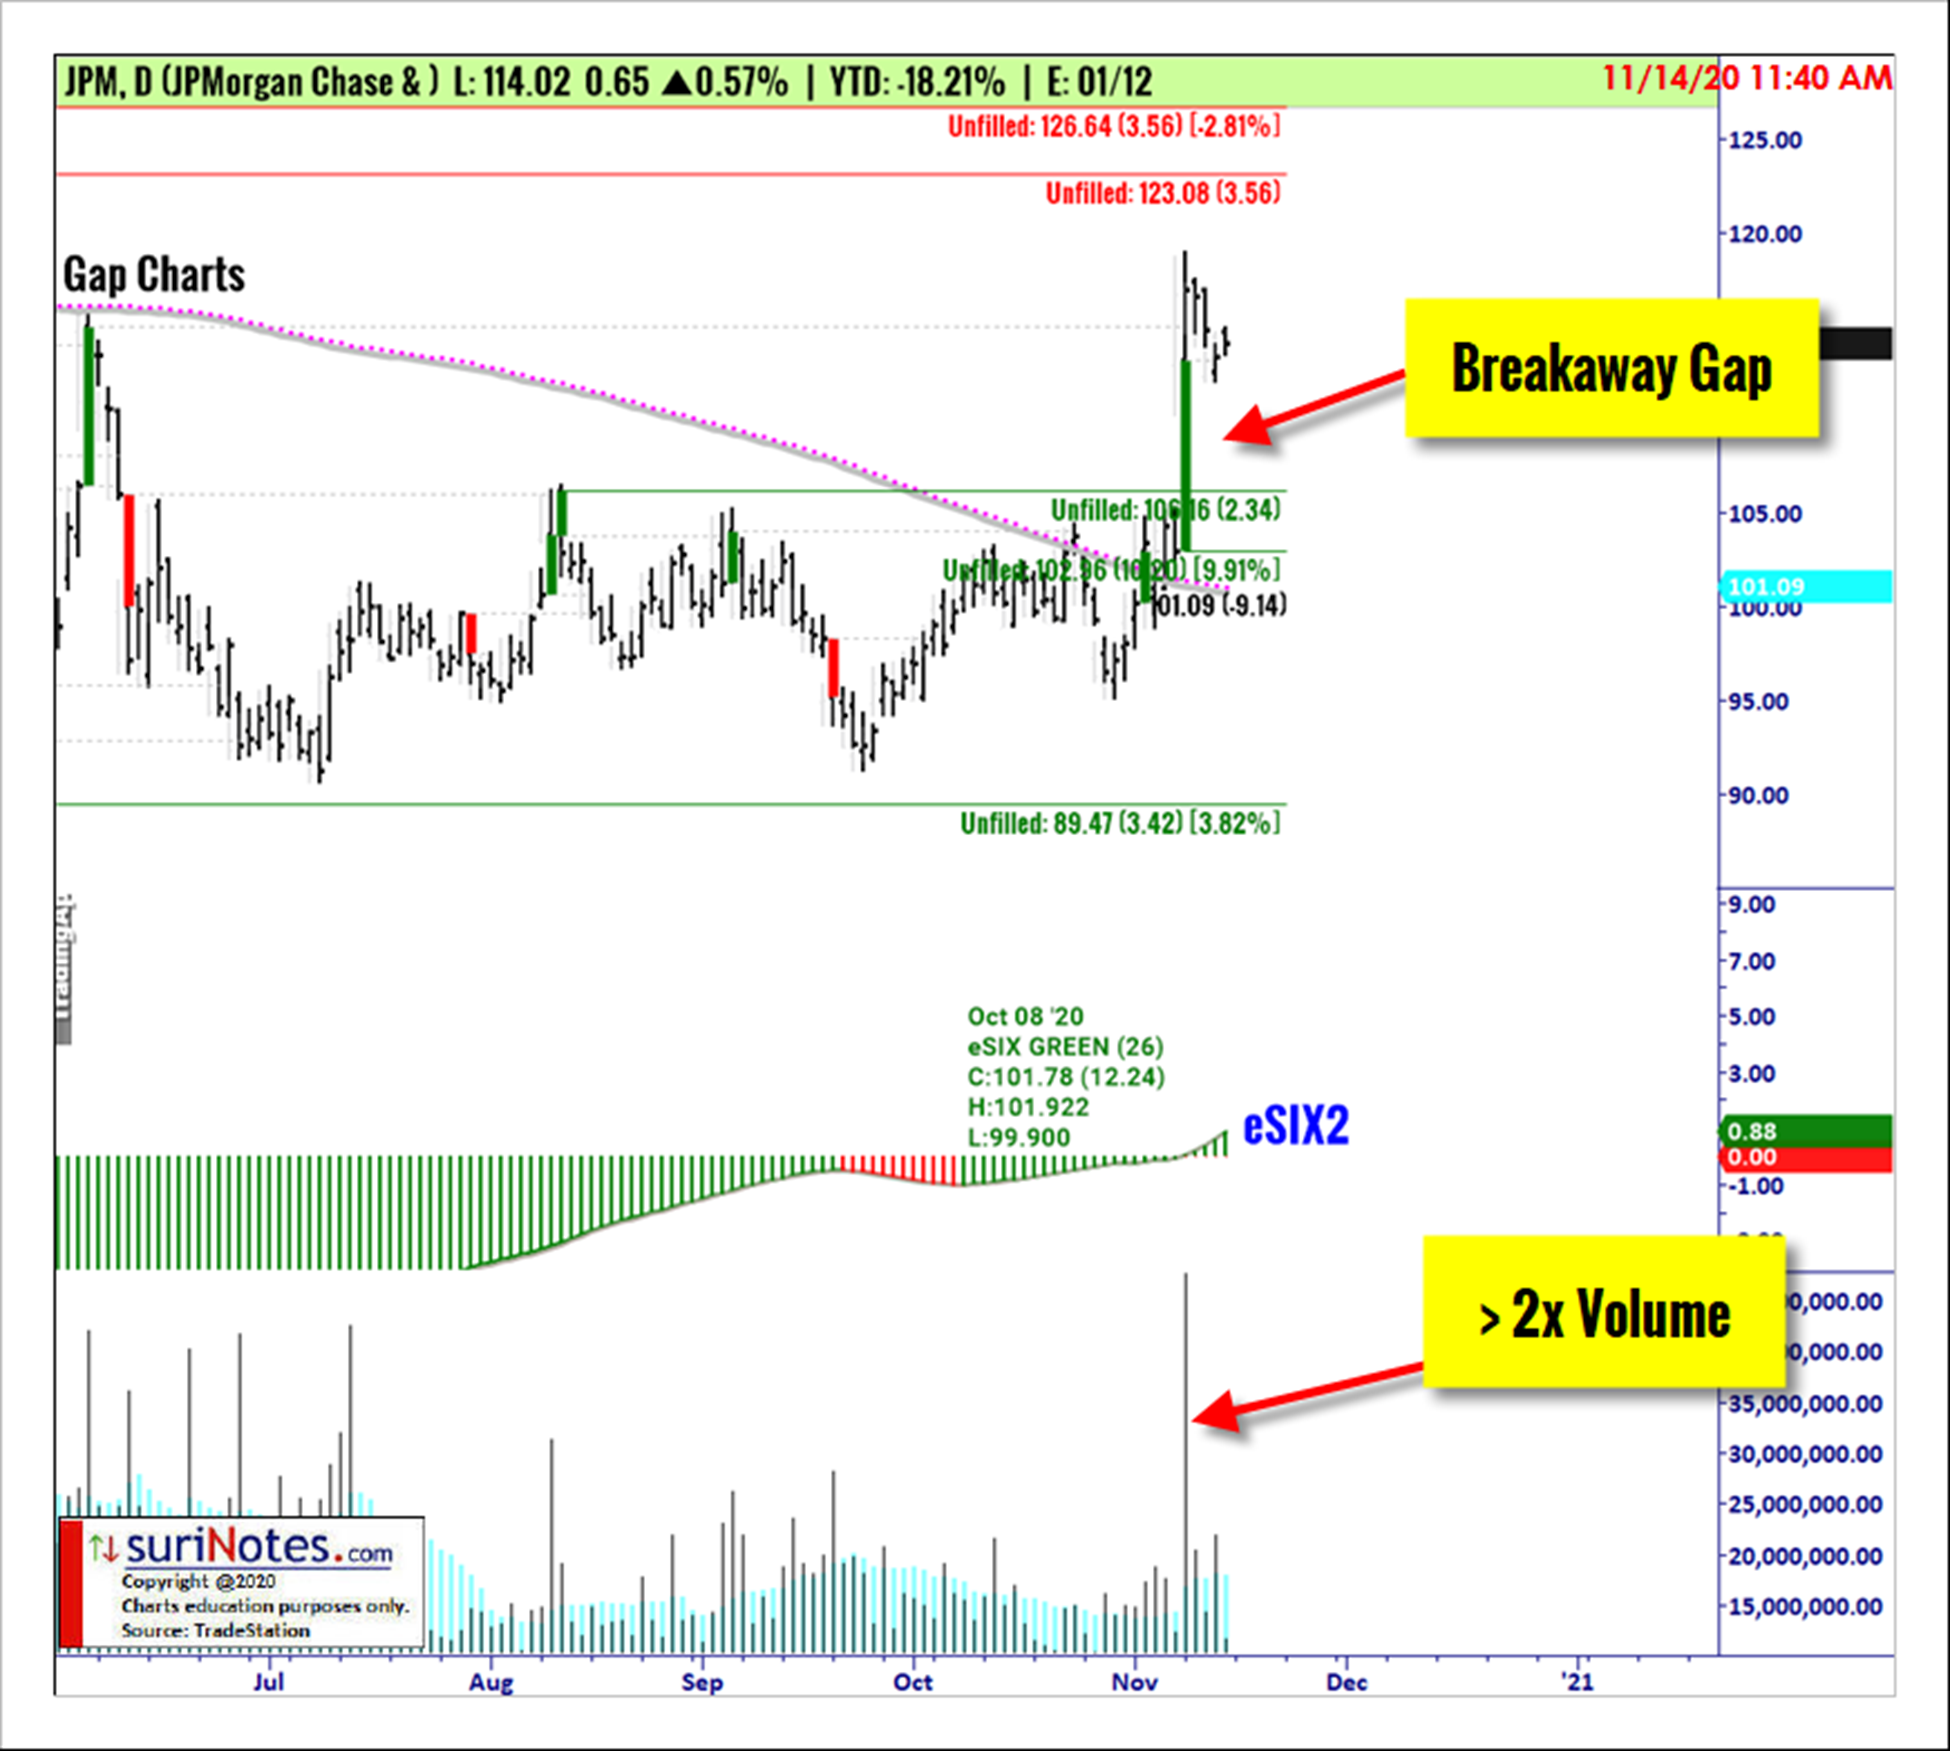
JPMorgan Chase (JPM)
The following daily chart of JPMorgan Chase & Co. shows a long-base formation from a low of $90 to $105 in June 2020 to November 2020. On 11/09/2020, JPM rallied from a previous close of $102.96 to an open of $113.16 (Gap Up: $10.20 Gap Perc%: 9.91%) breaking above the previous trading range with increased volume. JPM may continue its breakaway gap up rally towards the next unfilled gap levels at $126 and $135. A stop is placed below $102.
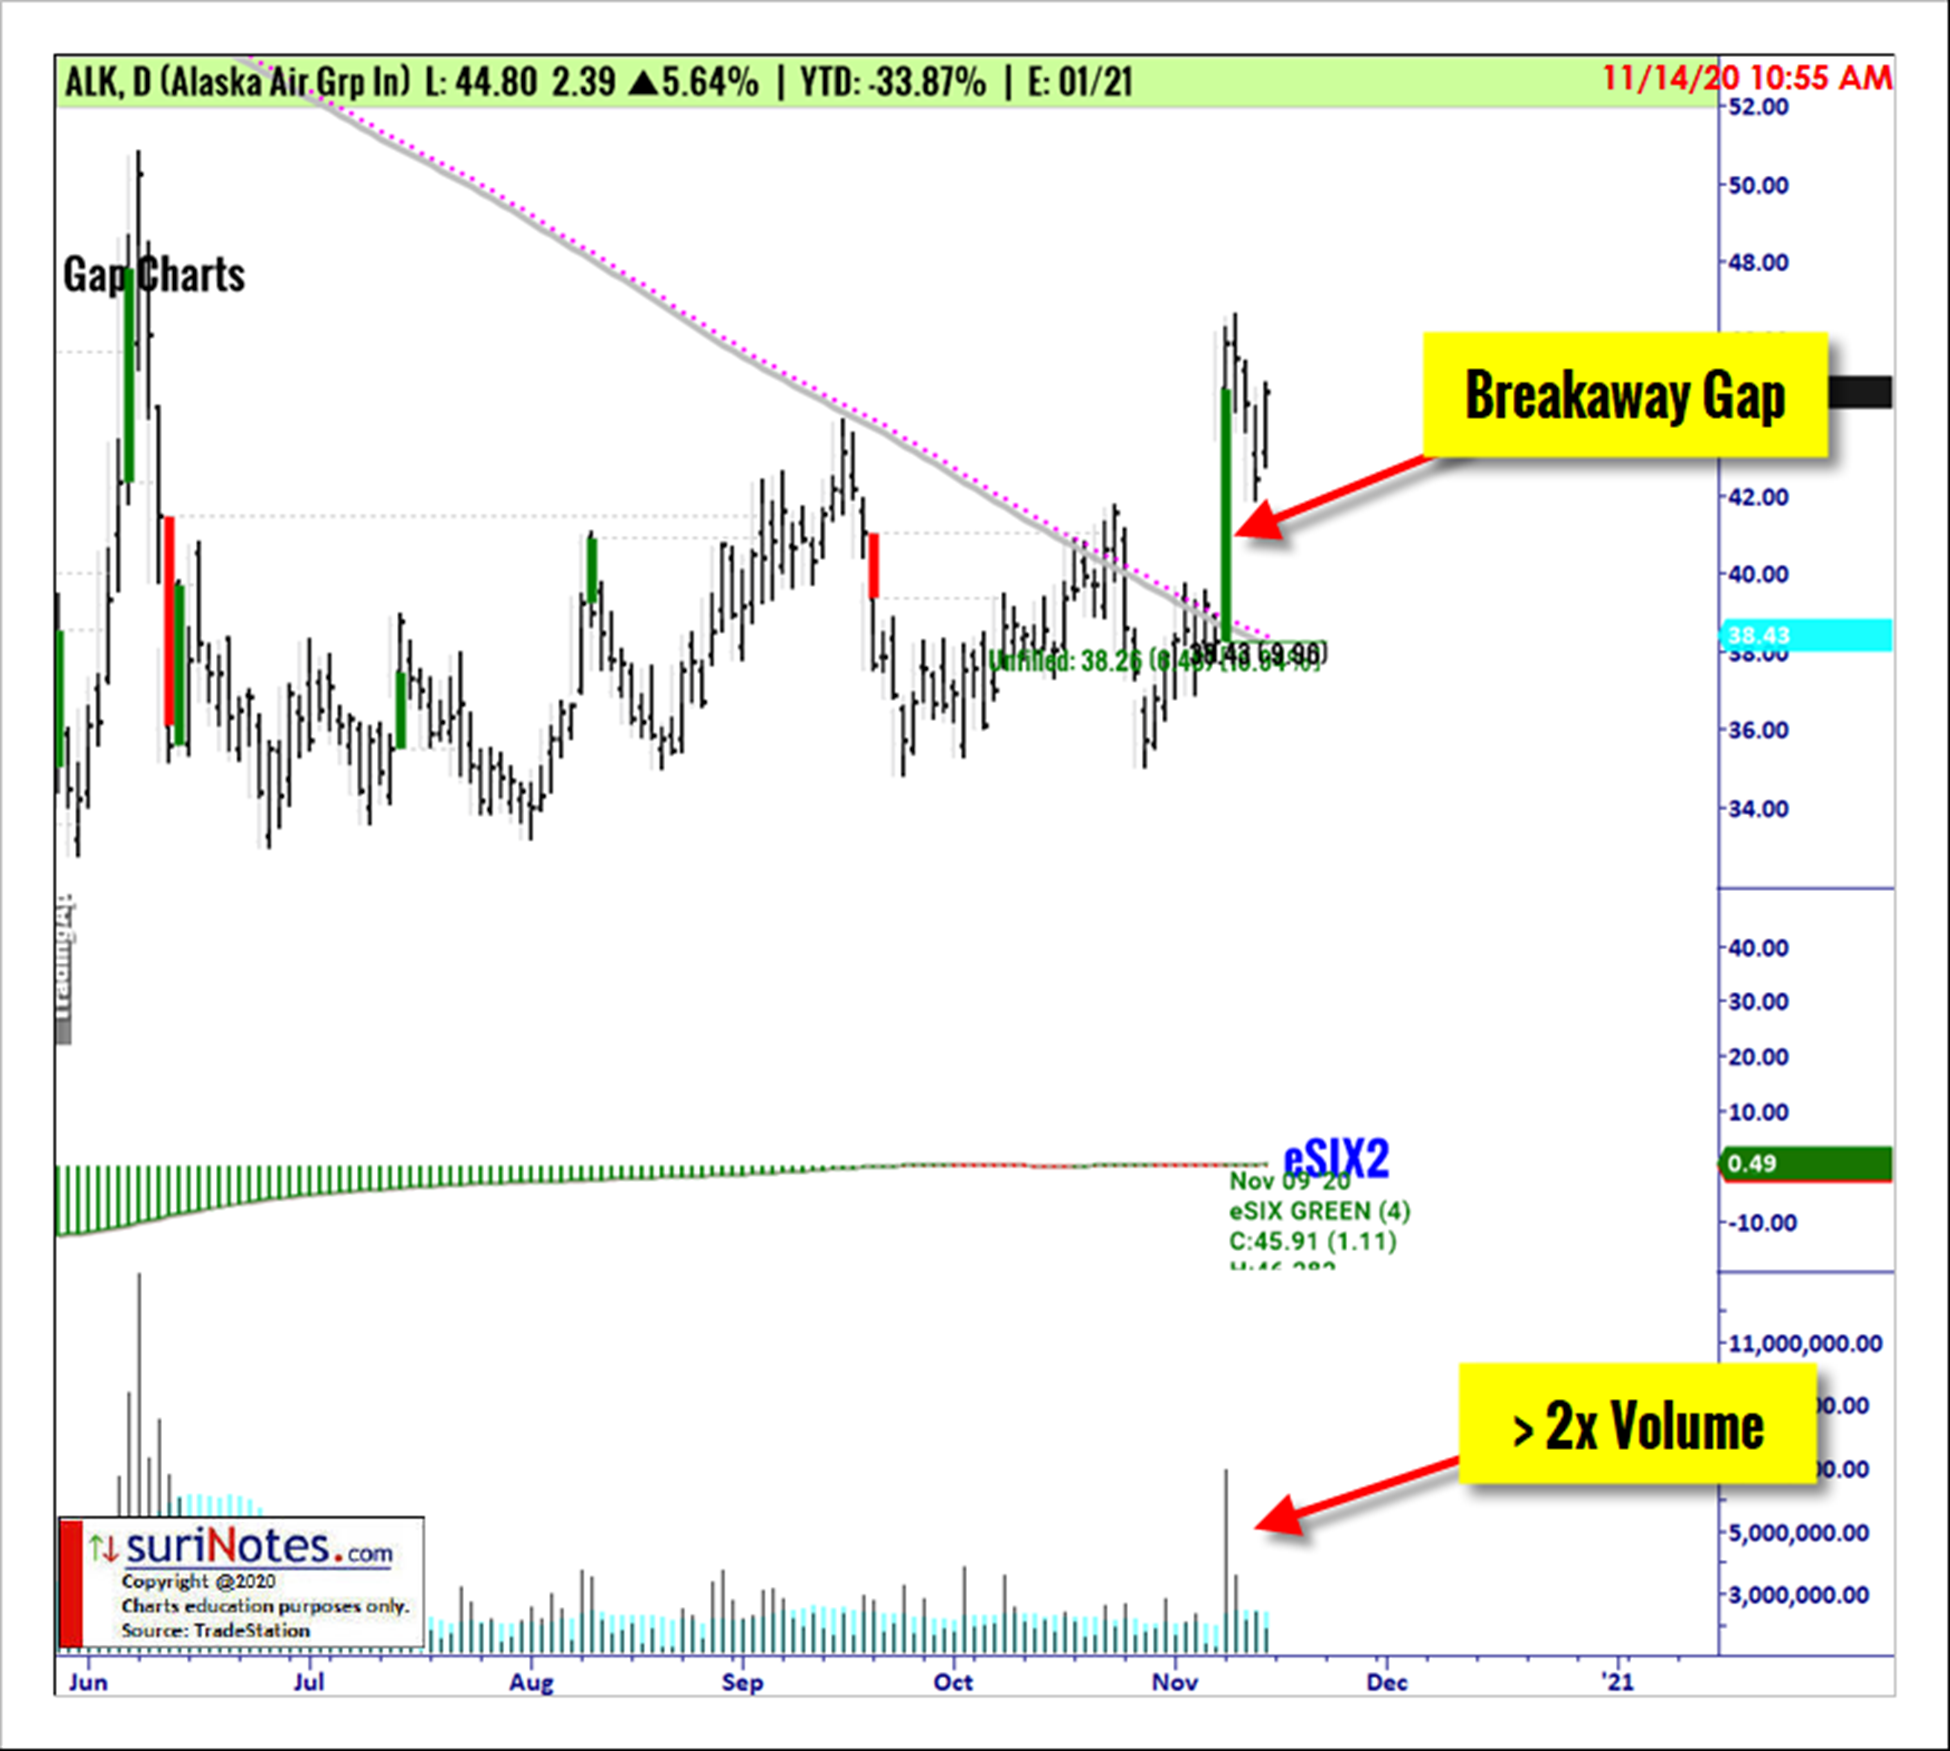
Alaska Air Group Inc. (ALK)
The following daily chart of Alaska Air Grp Inc. shows a long-base formation from a low of $33 to $42 in June 2020 to November 2020. On 11/09/2020, ALK rallied from a previous close of $38.26 to an open of $44.74 (Gap Up: $6.48 Gap Perc%: 16.94%) breaking above the previous trading range with increased volume. ALK may continue its breakaway gap up rally towards the next unfilled gap levels at $54 and $57. A stop is placed below $38.
To learn more about Suri Duddella, please visit SuriNotes.com.


