
The stock market ended 2020 with a moderate bang, which suggests that, at least in the early going, 2021 may be just an extension of 2020, states Joe Duarte of In the Money Options.
That said, it is important to note that the market leadership is starting to rotate away from some of the sectors that were stellar for large parts of 2020. So, the upshot is a market where two major factors are at play:
- The Fed’s money pumping and near-zero interest rates will likely continue to favor stocks
- There will be some noticeable winners and losers as money moves toward sectors with the more favorable fundamentals at the moment
A case in point is the action in the housing sector where big winners such as homebuilder DR Horton (DHI) ended the year in what unless it is soon reversed, what seems to be a potentially drawn-out downtrend.
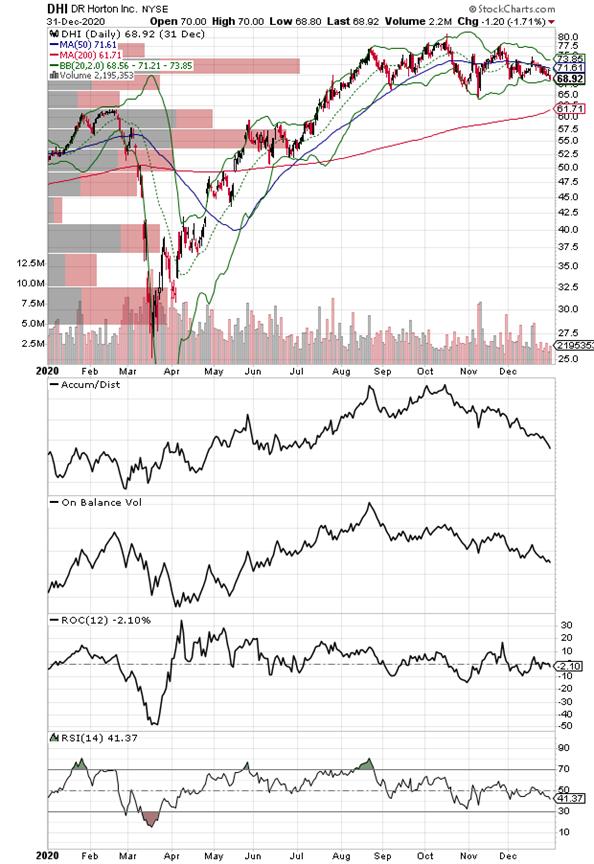
The stock, after roughly doubling in price since the March 2020 bottom in the market, ran into resistance near the $80 area and formed a clear triple top from which it has not recovered. Moreover, the Accumulation/Distribution (ADI) and On-Balance Volume (OBV) indicators are in respectively well-defined downtrend. Even more daunting is the fact that the stock recently broke below its 50-day moving average and looks as if it's ready to move toward its 200-day line.
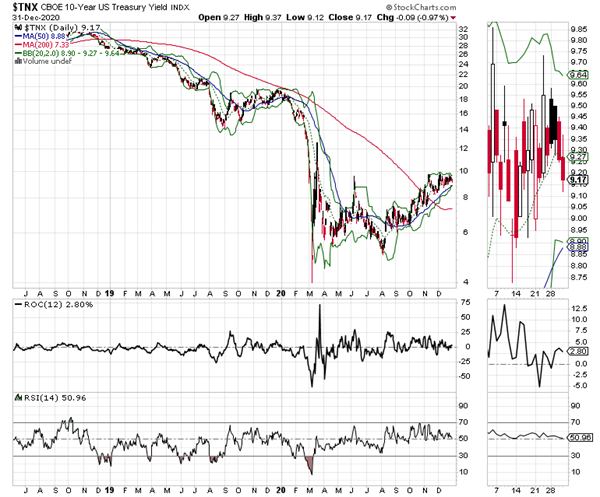
The slow demise of DHI is not accidental and seems to be related to the action in the bond market, where the US Ten-Year Note yield (TNX) has been bumping up against 1% for the past few weeks. This has caused a tangible increase in mortgage rates, which combined with rising housing prices has created a dilemma for homebuyers. Also consider the fact that on 12/30 even as bond yields fell, DHI remained below key resistance, a sign that the stock is very weak.
Of course, even as homebuilders are running into resistance, the real estate investment trusts, as in the iShares Real Estate ETF (IYR) are holding up much better as high home prices may be pushing those looking to relocate from COVID lockdowns and other issues toward apartments. Notice the inverse action in IYR compared to that of DHI. Specifically note:
- IYR is above its 50- and 200-day moving averages nearing a breakout
- Positive Accumulation Distribution (ADI)
- Positive On-Balance Volume (OBV)
Indeed, as it was for much of 2020, it looks as if 2021 is going to be all about selectivity.
So, is there a worry list? Of course, there is a worry list, and that means that there will be periods of volatility. But what we learned since 2016 is that the algos buy just about every dip. What that means is that we continue to trade with discipline, letting the market stop us out of positions as we watch the action in the New York Stock Advance Decline (NYAD) line (see below) for clues about the trend of the market while adhering to our sound trading rules:
- Don’t fight the Fed
- Trade in small lots
- Use well-placed sell stops (5-8%)
- Stick with strong stocks in strong sectors
- Consider option strategies
- Look for emerging potential winners in overlooked areas of the market
Market Breadth Ends Year with New High
The New York Stock Exchange Advance Decline line (NYAD) made a new high to end the week of 12/30, and simultaneously ended the year with an all-time high suggesting once again that as long as the Federal Reserve remains accommodative, the odds favor higher stock prices.
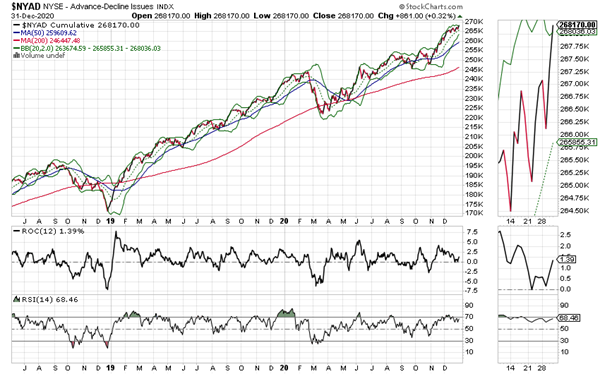
Of course, given the potential for negative surprises it is equally important to monitor the supporting indicators on NYAD, especially where the line is in relationship to its 50-day moving average and the RSI indicator. Currently, RSI is closing in on the 70 area, which would make NYAD overbought and ripe for consolidation. Simultaneously, it is well above its 50-day moving average, which means that it remains in an intermediate-term (weeks to months) uptrend.
Also remember that when RSI falls below 50 and NYAD breaks below its 50-day moving average it is a Duarte 50-50 sell signal. Not all of these signals lead to major declines, but the major declines of the past four years have all started with Duarte 50-50 sell signals.
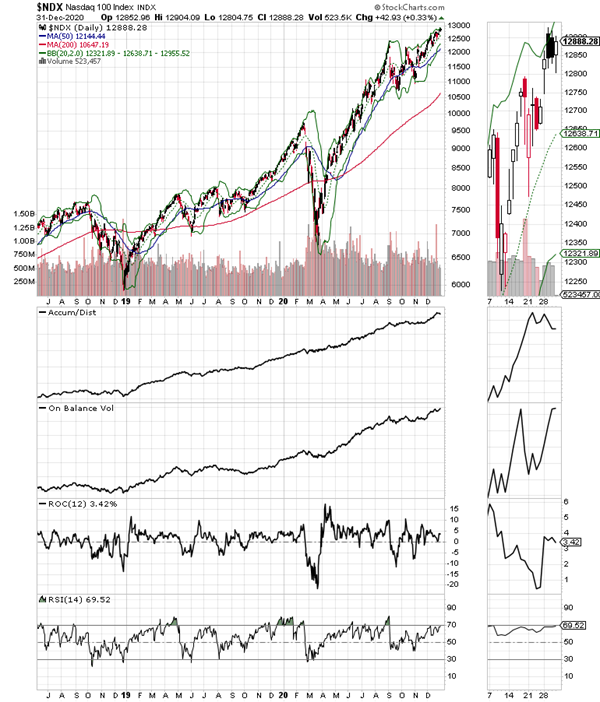
The Nasdaq 100 index (NDX) is within striking distance of a new high as well with the internal action of the index looking better than the index itself. It is often bullish to see breadth outperform the index.
All We Can Do is Trade One Day at a Time
As long as the Fed remains accommodative, the odds favor higher stock prices. Of course, there is some nuance involved in successfully getting to profits, as I described above. Specifically, I expect a rotation out of overbought sectors into those areas of the market that have some upside potential.
I remain concerned about the action in the bond market. And of course, there is always the potential for a political surprise or something else to upset the bullish apple cart. However, if 2021 is anything like 2020, we can expect a few bumps along the way. Perhaps we may even see a 10% or larger correction, just as we did in March 2020. Certainly, there is the potential for a real bear market out there somewhere. And there is some history to back that up as the first year of a new presidential cycle, either with a new president or a second termer, to be a difficult year for stock investors.
Still the bottom line is that barring something very extraordinary, the odds favor the bulls over the next 12 months.
To learn more about Joe Duarte, please visit JoeDuarteintheMoneyOptions.com.


