
The market remains overbought in many areas, and confirmed sell signals are beginning to appear, asserts Larry McMillan of Option Strategist.
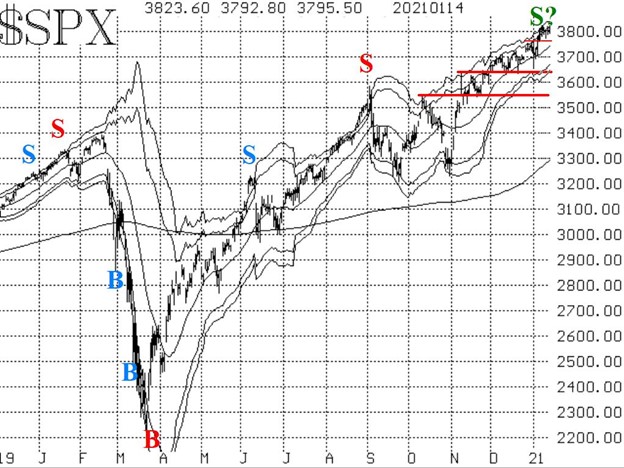
However, the most important indicator on the chart of S&P 500 (SPX) remains in a positive uptrend. There is support near 3725, more important support at 3630-3650, and then 3550.
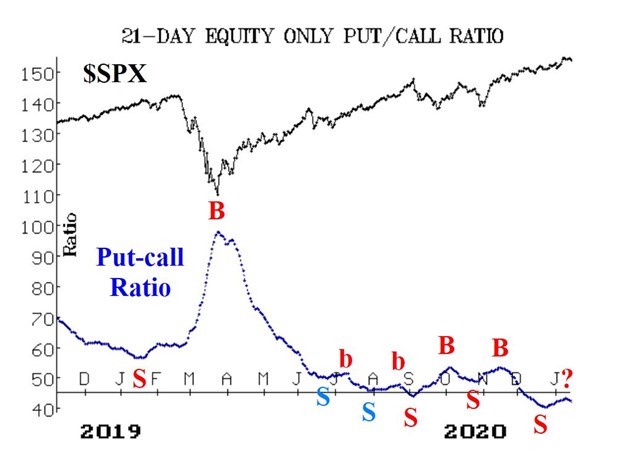
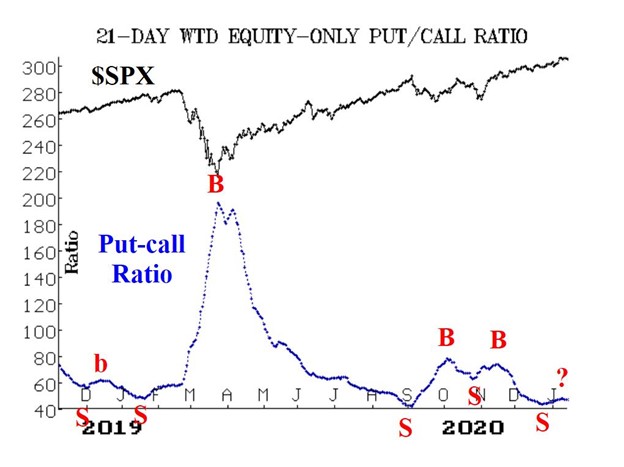
Equity-only put-call ratios in the charts below are beginning to drift downwards again and why we have marked their current status with a question mark. We continue to feel that these won't be solidly on sell signals until they begin to rise rapidly and there is an accompanying price breakdown in SPX.
Breadth has improved this week, and both breadth oscillators are solidly on buy signals at the current time. “Stocks only” breadth has been stronger than NYSE breadth, which is generally a precursor to a bullish move for the stock market.
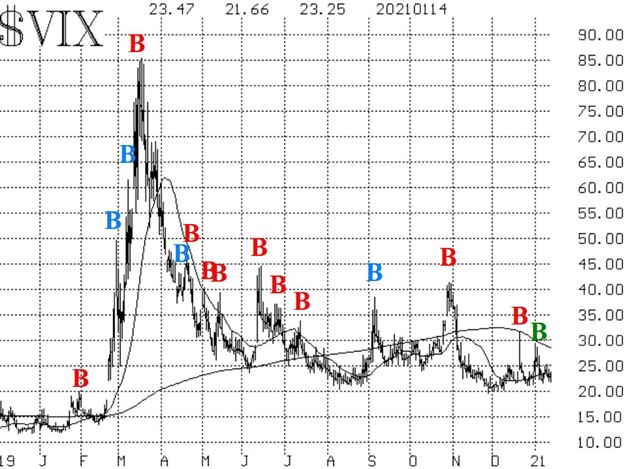
Implied volatility remains elevated, with SPX Volatility Index (VIX) hovering in the low 20s, and that shows some worry among traders about what might happen in the next couple of months. However, the VIX “spike peak” buy signal remains in effect, and VIX continues to trade below its now-declining 200-day moving average (which has fallen below 29).
In summary, we continue to maintain long positions in line with the major trend of the stock market (positive $SPX chart), but sell signals are not that far away. If SPX breaks down, then we would add to those bearish positions. For now, though, remain long and roll up where appropriate and tighten trailing stops.
MoneyShow’s Top 100 Stocks for 2021
The top performing newsletter advisors and analyst are back, and they just released their best stock ideas for 2021. Subscribe to our free daily newsletter, Top Pros' Top Picks, and be among the first wave of investors to see our best stock ideas for the new year.
To learn more about Larry McMillan, visit Option Strategist.


