
We are living through the mother of all momentum markets. Everyone seems to be bullish and no one seems to care about the possibility that stock prices may fall at some point in the future, notes Joe Duarte, technical expert and editor of In the Money Options.
Get Top Pros' Top Picks, MoneyShow’s free investing newsletter »
And who can blame investors for having such a mindset, given the fact that nothing ranging from a nuclear threat to the worst natural disasters seen in decades in the presence of terminal gridlock in the federal government, seems to be able to derail the general up trend in the stock market.
And who doesn’t like stock prices rising and quarterly account statements that show lofty portfolio growth time after time? Unfortunately, history shows that when everyone is bullish it is often a sign that a bear market may be just around the corner. But, this time is different, so why worry? Another round bar tender, it’s on me.
Personally, I’m neither bullish nor bearish. And why bother? This is a trending market, and even though nothing that used to work seems to hold any truth any more, price is still the ultimate truth.
So, at this point, it doesn’t matter what I or anyone thinks is going to happen next. All we can do is follow the trend, and remain on the lookout for any sign of a reversal.
Beyond that, we are all wasting our time pointing out signs of potential doom that have in the past been harbingers of future trouble. None of that seems to matter, until it does.
That said, I’m an old guy and I’ve seen plenty of bull and bear markets. And there are two interesting developments this week that are worth noting, if for no other reason that they are there and in the past they might have been important.
Advertisement
For one, the CNN Fear and Greed Index closed at a very bearish—downright scary—reading of 83 on 9/29. Just three weeks ago it was in the high 20s, a bullish reading which preceded the recent short term move to new highs on the S & P 500.
The second interesting development, which I will detail in the next section, is the almost straight up—parabolic—climb in the NYSE Advance Decline line (NYAD). Again, why worry? This time is different. Technical analysis is dead and all that matters is what the central banks and the robots decide.
Still, what I’m trying to say is that if the old market rules applied, these two developments would be worth noting and savvy traders might have taken some money off the table and hedged into Monday. Of course, in this brave robotic new world, who knows what any of this means?
Is the Market’s Breadth Unsustainable?
The market’s most reliable indicator, the NYAD is almost rising in a straight line. It’s such a sharp slope that it’s almost parabolic, and it may be a signal that we are in the last stage of this advance, at least in the near term
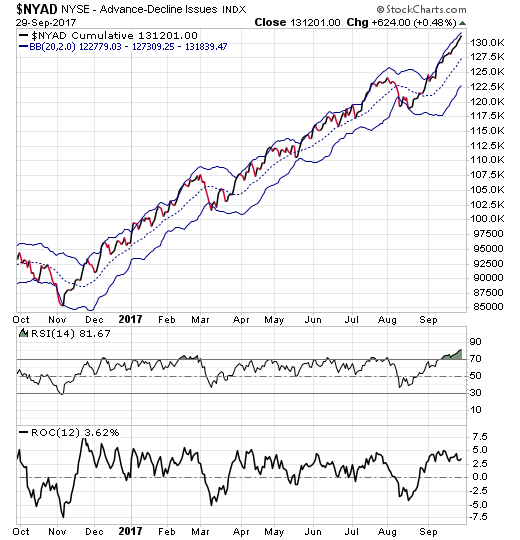
Parabolic advances are unsustainable since what goes up all at once must come down, often all at once as well. Along the same lines, note the very much overbought RSI indicator and the lack of confirmation on this latest move by the NYAD on the ROC indicator, which measures momentum. An overheated market which is losing momentum is not a good place to be when it reverses course.
Some Questions Rise on New Highs from S & P 500
The S&P 500 (SPX) made a new high this past week, confirming the new high on the NYSE Advance Decline line. And while this may turn out to be a truly bullish signal, there are some very subtle divergences visible.
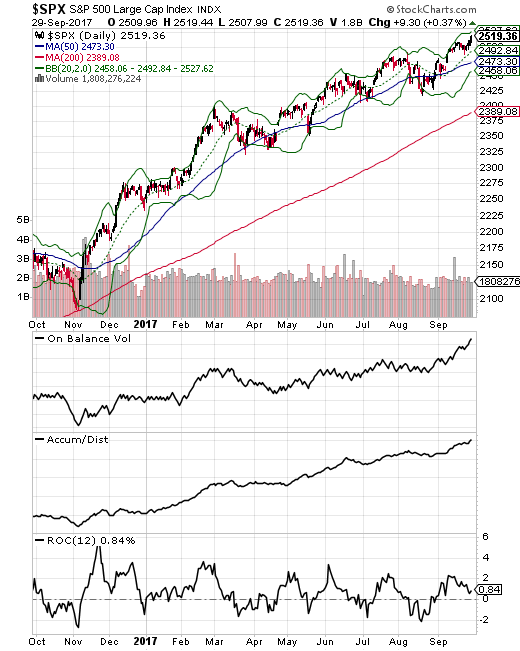
First, note On Balance Volume (OBV) and Accumulation Distribution (ADI) are very positive. This is bullish as it shows that buyers are very motivated at this point.
At the same time, though, volume on up days (blue bars) has been falling along with ROC. This combination of indicators suggests that, despite their conviction, there are not as many buyers as you’d like to see if the rally was truly going to move higher over the next few weeks.
Tech Stocks Look Tired
And while the S & P 500 seems to be game, the Nasdaq 100 (NDX) looks tired. This past week it did not make a new high along with SPX or NYAD. Furthermore, the OBV is flat, ADI is barely moving higher, and the ROC is below the zero line. Finally, the volume on down days (red bars) is overwhelming the volume on up days.
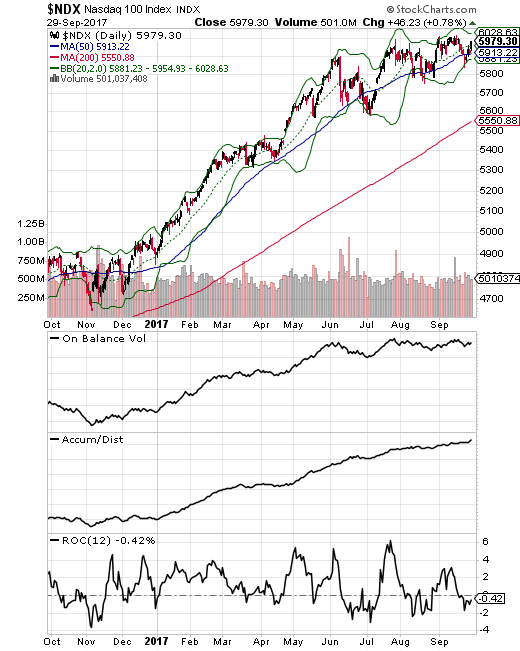
This combination of indicators suggests that if there is a continuation of the rally, despite the subtle warnings signs that the market needs a break, the tech stocks are more likely to follow than to lead.
Oil Stocks Due for Pause
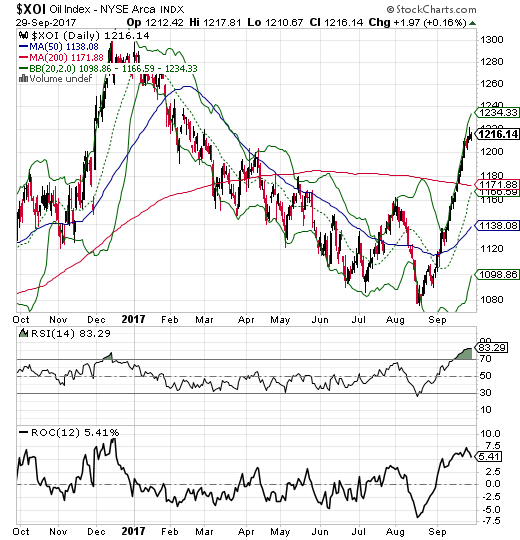
Finally, I want to look at the hottest sector in the market lately, the oil stocks. While tech stocks, see NDX above, have been lagging, money has been flowing into the energy sector's Oil Index (XOI).
But, as the chart shows, after a 13% move in the last month, even the XOI index looks to be tired. Note the overbought reading on RSI and the rolling over of the ROC.
If this was 1987
If this was 1987, a savvy trader would be cautious. But, this is 2017, and the markets would have us believe that old rules are no longer relevant. Yet, in my 30 years of doing this stuff, I’ve won more bets than I’ve lost while using the old rules than by believing the “this time is different” narrative.
So, I’m long, but I don’t trust this market. The bottom line is that I have everything on a very short leash. Momentum markets always end badly. Tread carefully, the more things change, the more they stay the same.


